OPEN-SOURCE SCRIPT
2band
Hello traders
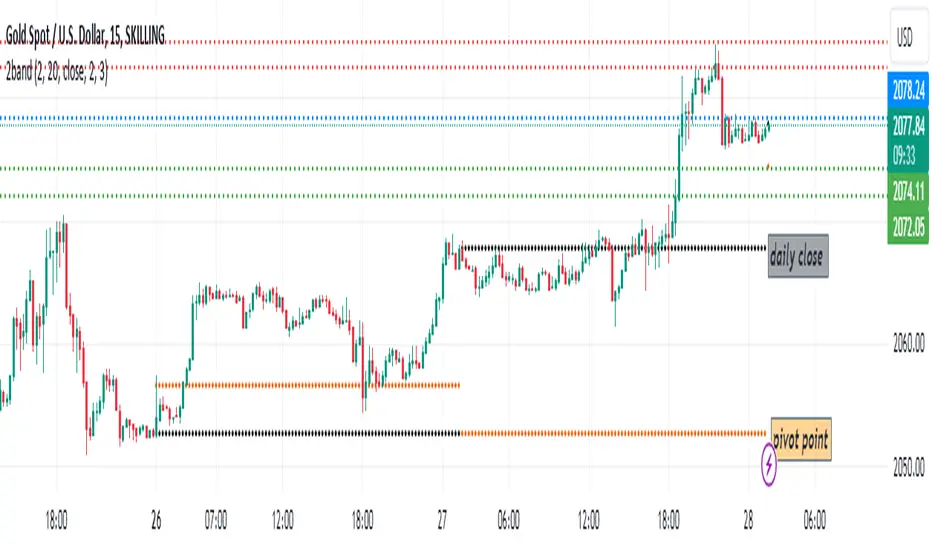
In this script, I have defined two bands with a deviation of 2 and 3
I designed the setup so that the upper lines represent red resistance, the lower lines represent green support, and the blue line represents the average price of the previous 20 candles in each time frame.
This code can be used mostly in time frames above 30 minutes and somehow predict possible price targets.
For example, if the price closes above the blue line in the one-hour time frame, the two fixed lines above are considered as targets and vice versa.
I have also added the pivot point calculation formula in orange
Most importantly, I added the closing price of the previous days in black
I hope it will be used by dear traders and you will support more for new works.
Açık kaynak kodlu komut dosyası
Gerçek TradingView ruhuyla, bu komut dosyasının mimarı, yatırımcıların işlevselliğini inceleyip doğrulayabilmesi için onu açık kaynaklı hale getirdi. Yazarı tebrik ederiz! Ücretsiz olarak kullanabilseniz de, kodu yeniden yayınlamanın Topluluk Kurallarımıza tabi olduğunu unutmayın.
Feragatname
Bilgiler ve yayınlar, TradingView tarafından sağlanan veya onaylanan finansal, yatırım, alım satım veya diğer türden tavsiye veya öneriler anlamına gelmez ve teşkil etmez. Kullanım Koşulları bölümünde daha fazlasını okuyun.