OPEN-SOURCE SCRIPT
Güncellendi Sembang Kari Traders - EMA & Wave Stacked Labels + EMA 34 Lines
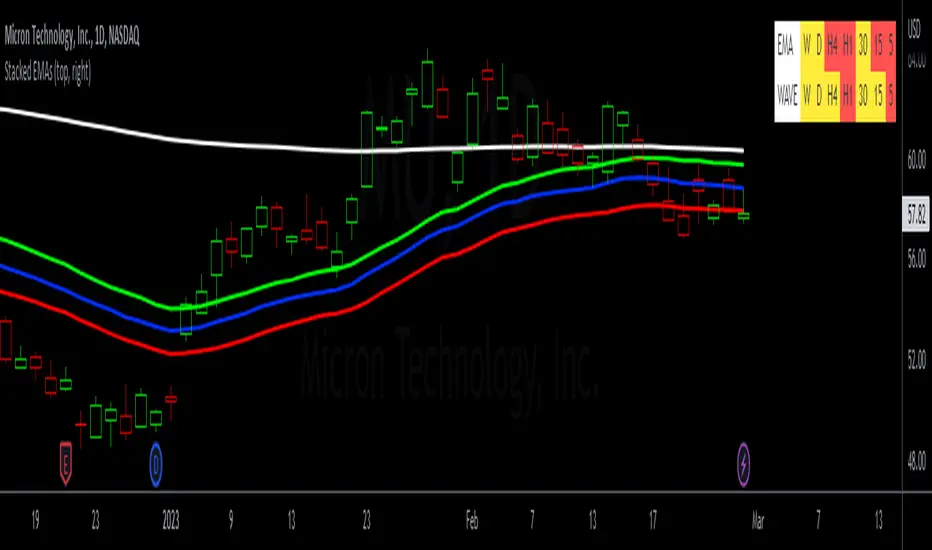
This script is 2 in 1 indicator.
1. Multi Timeframe EMA Labels
- This label indicator shows labels for EMA stacked up or EMA stacked down or EMA in sideway trend.
- EMA used in this script is EMA 8, EMA 21, EMA 34 and EMA 55.
- If the EMA 8 line is above EMA 21 line, and EMA 21 line is above EMA 34 line, and EMA 34 line is above EMA 55 line ( EMA STACKED UP) = the trend is BULLISH and the label will colored to GREEN on that timeframe.
- If the EMA 8 line is below EMA 21 line, and EMA 21 line is below EMA 34 line, and EMA 34 line is below EMA 55 line ( EMA STACKED DOWN) = the trend is BEARISH and the label will colored to RED on that timeframe.
- If either 1 of the EMA 8, or EMA 21, or EMA 34, or EMA 55 is NOT STACKED = the trend is SIDEWAY and the label will colored to YELLOW on that timeframe.
- Timeframe shows in label is Daily, 4 hours, 1 hour, 15 minutes and 5 minutes.
- This indicator labels will be useful to identifying trend in others timeframe without to look or open that other timeframe. Example, if u in 5 minutes timeframe chart, then u see that "D" is colored to GREEN, then straight will know that EMA 8, EMA 21, EMA 34 and EMA 55 is STACKED UP which means BULLISH without to look or open that Daily timeframe .
2. EMA 34 Lines
- This is indicator shows 3 exponential moving average line which is EMA 34 lines.
- This indicator will shows 3 lines which is GREEN, BLUE, and RED.
- The GREEN line is EMA 34 HIGH
- The BLUE line is EMA 34 CLOSE
- The RED line is EMA 34 BLUE
Trade Idea
- The idea using this indicator is we want to take an entry setup when the candle pull back to EMA 34 lines and at the same time using the EMA labels to be confirmation as label will indicates trends in multiple timeframe.
- When price moved far away from EMA 34 lines, then wait till price pullback to EMA lines and confirmed it by trend labels provided to take take a entry setup.
- this indicator can be used on all tickers
Sürüm Notları
Updated version, added time frame weekly and also added EMA200 line for reference.Açık kaynak kodlu komut dosyası
Gerçek TradingView ruhuna uygun olarak, bu komut dosyasının oluşturucusu bunu açık kaynaklı hale getirmiştir, böylece yatırımcılar betiğin işlevselliğini inceleyip doğrulayabilir. Yazara saygı! Ücretsiz olarak kullanabilirsiniz, ancak kodu yeniden yayınlamanın Site Kurallarımıza tabi olduğunu unutmayın.
Feragatname
Bilgiler ve yayınlar, TradingView tarafından sağlanan veya onaylanan finansal, yatırım, işlem veya diğer türden tavsiye veya tavsiyeler anlamına gelmez ve teşkil etmez. Kullanım Şartları'nda daha fazlasını okuyun.
Açık kaynak kodlu komut dosyası
Gerçek TradingView ruhuna uygun olarak, bu komut dosyasının oluşturucusu bunu açık kaynaklı hale getirmiştir, böylece yatırımcılar betiğin işlevselliğini inceleyip doğrulayabilir. Yazara saygı! Ücretsiz olarak kullanabilirsiniz, ancak kodu yeniden yayınlamanın Site Kurallarımıza tabi olduğunu unutmayın.
Feragatname
Bilgiler ve yayınlar, TradingView tarafından sağlanan veya onaylanan finansal, yatırım, işlem veya diğer türden tavsiye veya tavsiyeler anlamına gelmez ve teşkil etmez. Kullanım Şartları'nda daha fazlasını okuyun.