OPEN-SOURCE SCRIPT
Rolling Net Volume
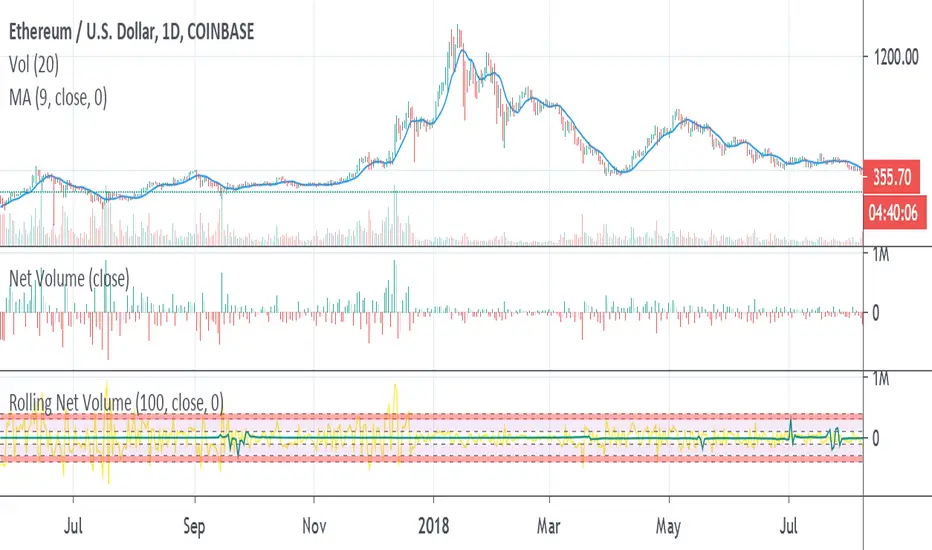
May still make changes, the current study should be helpful as is. Looking to highlight potential relative trend exhaustion in net volume. Should be most effective for stable supply assets. We're looking at an 100 day moving average of net volume essentially. The values of the RNV are slightly exaggerated to help with visibility PLEASE bear this in mind. Never the less, you can look at many commodities and notice moderate and extreme trend exhaustion on the positive and negative side using the transparent bands above and below. The less transparent red band perhaps suggests an opportunity to open a position against the current direction. It's not perfect, I may try to improve it. I am definitely open to feedback and appreciate it very much in advance.
Açık kaynak kodlu komut dosyası
Gerçek TradingView ruhuyla, bu komut dosyasının mimarı, yatırımcıların işlevselliğini inceleyip doğrulayabilmesi için onu açık kaynaklı hale getirdi. Yazarı tebrik ederiz! Ücretsiz olarak kullanabilseniz de, kodu yeniden yayınlamanın Topluluk Kurallarımıza tabi olduğunu unutmayın.
Feragatname
Bilgiler ve yayınlar, TradingView tarafından sağlanan veya onaylanan finansal, yatırım, alım satım veya diğer türden tavsiye veya öneriler anlamına gelmez ve teşkil etmez. Kullanım Koşulları bölümünde daha fazlasını okuyun.