PROTECTED SOURCE SCRIPT
Güncellendi Precision Candles
This Pine Script is designed to help you uncover hidden divergences among multiple assets by tracking how their candles close. Imagine you're analyzing three different assets — they could be indices, currencies, or even cryptocurrencies — and you want to know when one of them is moving out of sync with the others. That’s where this script comes into play.
First, it gives you the flexibility to choose custom ticker symbols or rely on predefined ones based on different asset classes like metals, bonds, or altcoins. Once the symbols are set, the script continuously monitors the opening, high, low, and closing prices of each asset.
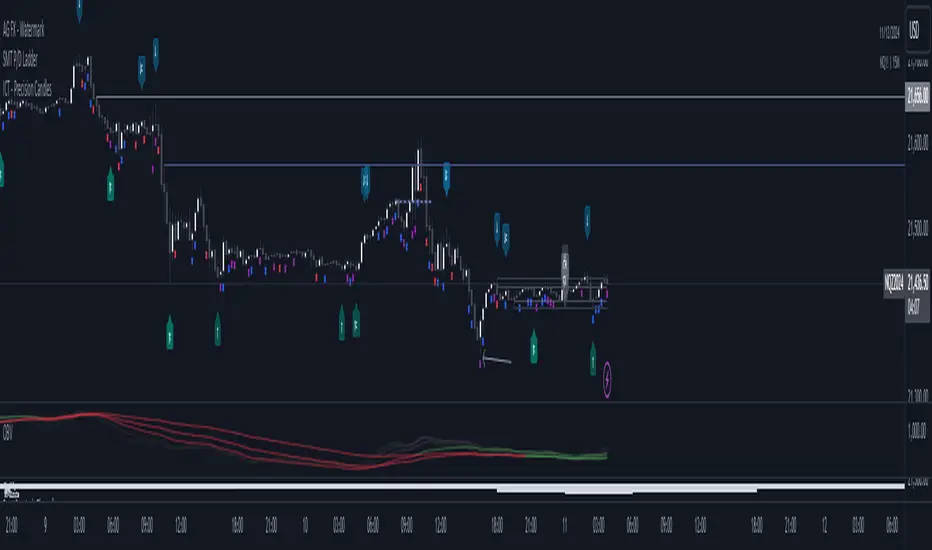
The magic happens when it determines the nature of each candle: is it bullish or bearish? By comparing these closing behaviors, the script checks for any discrepancies — situations where at least one asset diverges from the trend of the others. When this happens, the script plots a red "PC" marker below the bar on your chart, drawing your attention to these moments of divergence.
This tool can be invaluable for traders looking to spot unique market dynamics, identify potential trading opportunities, or simply get insights into how different assets behave in relation to each other. It's a simple but powerful way to keep an eye on correlations and anticipate shifts in market sentiment.
First, it gives you the flexibility to choose custom ticker symbols or rely on predefined ones based on different asset classes like metals, bonds, or altcoins. Once the symbols are set, the script continuously monitors the opening, high, low, and closing prices of each asset.
The magic happens when it determines the nature of each candle: is it bullish or bearish? By comparing these closing behaviors, the script checks for any discrepancies — situations where at least one asset diverges from the trend of the others. When this happens, the script plots a red "PC" marker below the bar on your chart, drawing your attention to these moments of divergence.
This tool can be invaluable for traders looking to spot unique market dynamics, identify potential trading opportunities, or simply get insights into how different assets behave in relation to each other. It's a simple but powerful way to keep an eye on correlations and anticipate shifts in market sentiment.
Sürüm Notları
This Pine Script is designed to help you uncover hidden divergences among multiple assets by tracking how their candles close. Imagine you're analyzing three different assets — they could be indices, currencies, or even cryptocurrencies — and you want to know when one of them is moving out of sync with the others. That’s where this script comes into play.First, it gives you the flexibility to choose custom ticker symbols or rely on predefined ones based on different asset classes like metals, bonds, or altcoins. Once the symbols are set, the script continuously monitors the opening, high, low, and closing prices of each asset.
The magic happens when it determines the nature of each candle: is it bullish or bearish? By comparing these closing behaviors, the script checks for any discrepancies — situations where at least one asset diverges from the trend of the others. When this happens, the script plots a red "PC" marker below the bar on your chart, drawing your attention to these moments of divergence.
This tool can be invaluable for traders looking to spot unique market dynamics, identify potential trading opportunities, or simply get insights into how different assets behave in relation to each other. It's a simple but powerful way to keep an eye on correlations and anticipate shifts in market sentiment.
Sürüm Notları
Deleted the TextSürüm Notları
Now with Timezone filters and Layered PCSürüm Notları
Fond Size changeSürüm Notları
FondSürüm Notları
Lot of changesSürüm Notları
Updated to Version 6Bug Fixes for some colours
added all the Micros aswell
Korumalı komut dosyası
Bu komut dosyası kapalı kaynak olarak yayınlanmaktadır. Ancak, ücretsiz ve herhangi bir sınırlama olmaksızın kullanabilirsiniz – daha fazla bilgiyi buradan edinebilirsiniz.
Feragatname
Bilgiler ve yayınlar, TradingView tarafından sağlanan veya onaylanan finansal, yatırım, alım satım veya diğer türden tavsiye veya öneriler anlamına gelmez ve teşkil etmez. Kullanım Koşulları bölümünde daha fazlasını okuyun.