OPEN-SOURCE SCRIPT
Güncellendi TFEX_INDICATOR_SET13
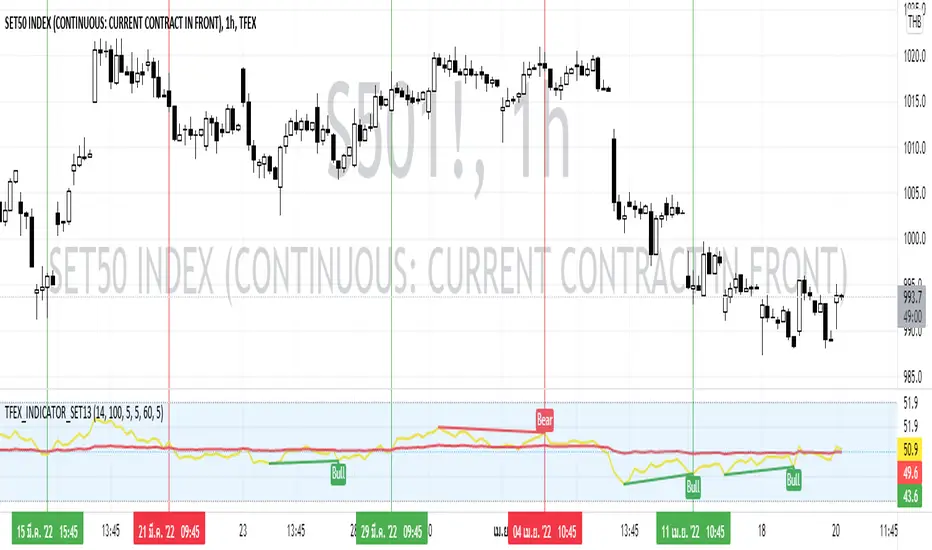
This Indicator use the calculated RSI of the top 13 stocks that have the highest market capitalization in  SET50 where suitable for TFEX trading(
 S501!).
Conducted with 2 RSI period as follow:
How to use:
1) Use this Indicator by Crossover
2) Use this Indicator by Divergence of RSI Main
3) The combination of Divergence and Crossover
Preferred Timeframe
Conducted with 2 RSI period as follow:
- RSI Main (14)
- RSI Average (100)
How to use:
1) Use this Indicator by Crossover
- If the RSI Main Cross UP the RSI Average can assume as BUY SIGNAL
- If the RSI Main Cross DOWN the RSI Average can assume as SELL SIGNAL
2) Use this Indicator by Divergence of RSI Main
- If the RSI Main got any Regular Bullish or Hidden Bullish can assume as BUY SIGNAL
- If the RSI Main got any Regular Bearish or Hidden Bearish can assume as SELL SIGNAL
3) The combination of Divergence and Crossover
- If the RSI Main got any Regular Bullish or Hidden Bullish then pending for the RSI Main Cross UP the RSI Average which can assume as BUY SIGNAL
- If the RSI Main got any Regular Bearish or Hidden Bearish then pending for the RSI Main Cross DOWN the RSI Average which can assume as SELL SIGNAL
Preferred Timeframe
- 4H
- 2H
- 1H
Sürüm Notları
Update name of the RSI appearance settingSürüm Notları
Add Alert ConditionsSürüm Notları
Change Calculation from SCB to EA as SCB delisted in SETSürüm Notları
Update Alert condition to have Overbought and OversoldEdit last description: Change Calculation from SCB to CPN as SCB delisted in SET
Sürüm Notları
Update ChartSürüm Notları
Update NEW SET13 List- AOT
- PTT
- DELTA
- PTTEP
- BCP
- CPALL
- KBANK
- DTAC
- BBL
- BDMS
- ESSO
- KTB
- GULF
Sürüm Notları
Update new stock listAçık kaynak kodlu komut dosyası
Gerçek TradingView ruhuyla, bu komut dosyasının mimarı, yatırımcıların işlevselliğini inceleyip doğrulayabilmesi için onu açık kaynaklı hale getirdi. Yazarı tebrik ederiz! Ücretsiz olarak kullanabilseniz de, kodu yeniden yayınlamanın Topluluk Kurallarımıza tabi olduğunu unutmayın.
Feragatname
Bilgiler ve yayınlar, TradingView tarafından sağlanan veya onaylanan finansal, yatırım, alım satım veya diğer türden tavsiye veya öneriler anlamına gelmez ve teşkil etmez. Kullanım Koşulları bölümünde daha fazlasını okuyun.
Açık kaynak kodlu komut dosyası
Gerçek TradingView ruhuyla, bu komut dosyasının mimarı, yatırımcıların işlevselliğini inceleyip doğrulayabilmesi için onu açık kaynaklı hale getirdi. Yazarı tebrik ederiz! Ücretsiz olarak kullanabilseniz de, kodu yeniden yayınlamanın Topluluk Kurallarımıza tabi olduğunu unutmayın.
Feragatname
Bilgiler ve yayınlar, TradingView tarafından sağlanan veya onaylanan finansal, yatırım, alım satım veya diğer türden tavsiye veya öneriler anlamına gelmez ve teşkil etmez. Kullanım Koşulları bölümünde daha fazlasını okuyun.