OPEN-SOURCE SCRIPT
VWAP Volume Profile [BigBeluga]

🔵 OVERVIEW
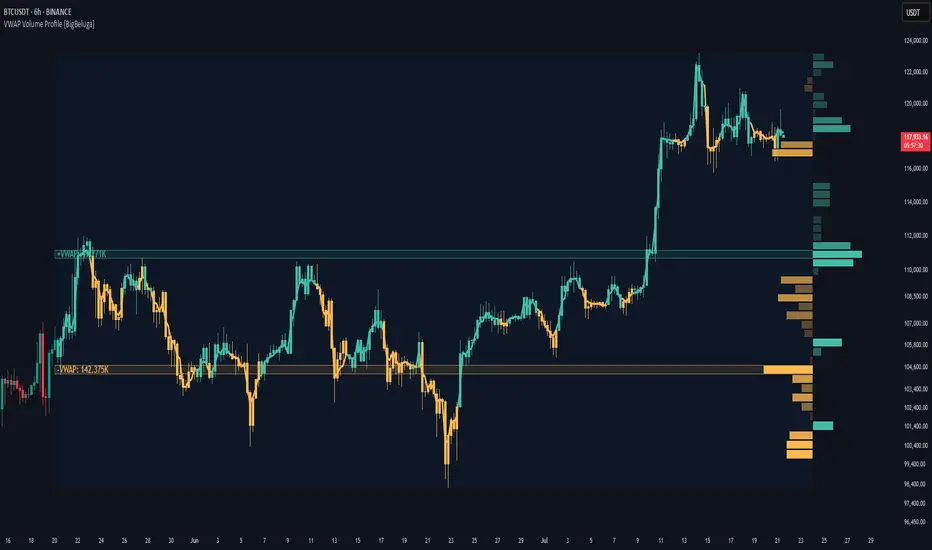
VWAP Volume Profile [BigBeluga] is an advanced hybrid of the VWAP and volume profile concepts. It visualizes how volume accumulates relative to VWAP movement—separating rising (+VWAP) and declining (−VWAP) activity into two mirrored horizontal profiles. It highlights the dominant price bins (POCs) where volume peaked during each directional phase, helping traders spot hidden accumulation or distribution zones.
🔵 CONCEPTS
🔵 FEATURES
🔵 HOW TO USE
🔵 CONCLUSION
VWAP Volume Profile [BigBeluga] merges two essential concepts—volume and VWAP—into a single, high-precision tool. By visualizing how volume behaves in relation to VWAP movement, it uncovers hidden dynamics often missed by traditional profiles. Perfect for intraday and swing traders who want a more nuanced read on market structure, trend strength, and volume flow.
VWAP Volume Profile [BigBeluga] is an advanced hybrid of the VWAP and volume profile concepts. It visualizes how volume accumulates relative to VWAP movement—separating rising (+VWAP) and declining (−VWAP) activity into two mirrored horizontal profiles. It highlights the dominant price bins (POCs) where volume peaked during each directional phase, helping traders spot hidden accumulation or distribution zones.
🔵 CONCEPTS
- VWAP-Driven Profiling: Unlike standard volume profiles, this tool segments volume based on VWAP movement—accumulating positive or negative volume depending on VWAP slope.
- Dual-Sided Profiles: Profiles expand horizontally to the right of price. Separate bins show rising (+) and falling (−) VWAP volume.
- Bin Logic: Volume is accumulated into defined horizontal bins based on VWAP’s position relative to price ranges.
- Gradient Coloring: Volume bars are colored with a dynamic gradient to emphasize intensity and direction.
- POC Highlighting: The highest-volume bin in each profile type (+/-) is marked with a transparent box and label.
- Contextual VWAP Line: VWAP is plotted and dynamically colored (green = rising, orange = falling) for instant trend context.
- Candle Overlay: Price candles are recolored to match the VWAP slope for full visual integration.
🔵 FEATURES
- Dual-sided horizontal volume profiles based on VWAP slope.
- Supports rising VWAP [+], falling VWAP [−], or both simultaneously.
- Customizable number of bins and lookback period.
- Dynamically colored VWAP line to show rising/falling bias.
- POC detection and labeling with volume values for +VWAP and −VWAP.
- Candlesticks are recolored to match VWAP bias for intuitive momentum tracking.
- Optional background boxes with customizable styling.
- Adaptive volume scaling to normalize bar length across markets.
🔵 HOW TO USE
- Use POC zones to identify high-volume consolidation areas and potential support/resistance levels.
- Watch for shifts in VWAP direction and observe how volume builds differently during uptrends and downtrends.
- Use the gradient profile shape to detect accumulation (widening volume below price) or distribution (above price).
- Use candle coloring for real-time confirmation of VWAP bias.
- Adjust the profile period or bin count to fit your trading style (e.g., intraday scalping or swing trading).
🔵 CONCLUSION
VWAP Volume Profile [BigBeluga] merges two essential concepts—volume and VWAP—into a single, high-precision tool. By visualizing how volume behaves in relation to VWAP movement, it uncovers hidden dynamics often missed by traditional profiles. Perfect for intraday and swing traders who want a more nuanced read on market structure, trend strength, and volume flow.
Açık kaynak kodlu komut dosyası
Gerçek TradingView ruhuyla, bu komut dosyasının mimarı, yatırımcıların işlevselliğini inceleyip doğrulayabilmesi için onu açık kaynaklı hale getirdi. Yazarı tebrik ederiz! Ücretsiz olarak kullanabilseniz de, kodu yeniden yayınlamanın Topluluk Kurallarımıza tabi olduğunu unutmayın.
🔵Gain access to our powerful tools : bigbeluga.com/tv
🔵Join our free discord for updates : bigbeluga.com/discord
All scripts & content provided by BigBeluga are for informational & educational purposes only.
🔵Join our free discord for updates : bigbeluga.com/discord
All scripts & content provided by BigBeluga are for informational & educational purposes only.
Feragatname
Bilgiler ve yayınlar, TradingView tarafından sağlanan veya onaylanan finansal, yatırım, alım satım veya diğer türden tavsiye veya öneriler anlamına gelmez ve teşkil etmez. Kullanım Koşulları bölümünde daha fazlasını okuyun.