OPEN-SOURCE SCRIPT
Güncellendi Webby's RS Line
The Relative Strength (RS) line is something many investors are familiar with. It is used to measure a stocks performance versus the S&P 500 and is typically calculated by dividing the closing price of the stock by the closing price of the S&P. This means if a stock moves up and the S&P moves down or the stock moves up more than the S&P the RS line will increase, if the stock moves down while the S&P moves up the line will decrease.
While the standard RS line is a powerful tool, Mike Webster recently discussed how he has made changes to the standard RS line and also uses a 21 exponential moving average of the RS line to help guide his decision making. This script puts those new twists on the standard RS line, by first calculating the RS line using the low of both the security and the S&P rather than the closing prices. Next it measures the 21-day exponential moving average of the RS line and plots the distance between the two as a histogram.
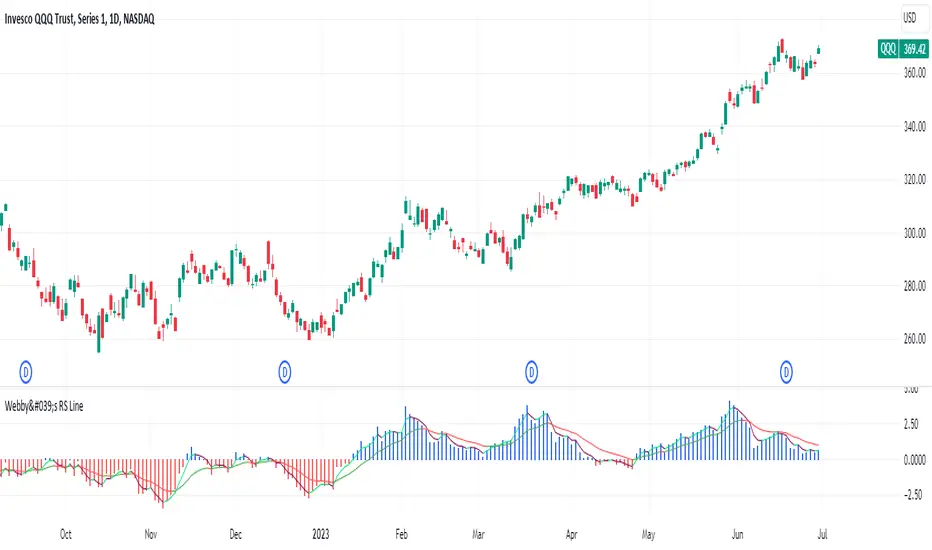
A strong trending stock that is out performing the market will see an extended period of a positive blue histogram signifying the RS line is above the 21-ema.

While on the other hand a stock in a downtrend that is underperforming will see a negative red histogram a red histogram signifying the RS line is below the 21-ema.

On top of all of that, the indicator also keeps 3 & 13 exponential moving average of the distance between the RS line and the 21 ema to help identify shorter term relative strength and capture more immediate shifts in momentum. Both of those are plotted on the histogram as well and will change color as they rise and fall making it easy to spot the direction.
Indicator options include:
* Note this indicator does not plot the actual RS line, it is the histogram representing the distance between the RS line calculated using the lows and the 21 ema, as well as the two ema's of the relationship.
While the standard RS line is a powerful tool, Mike Webster recently discussed how he has made changes to the standard RS line and also uses a 21 exponential moving average of the RS line to help guide his decision making. This script puts those new twists on the standard RS line, by first calculating the RS line using the low of both the security and the S&P rather than the closing prices. Next it measures the 21-day exponential moving average of the RS line and plots the distance between the two as a histogram.
A strong trending stock that is out performing the market will see an extended period of a positive blue histogram signifying the RS line is above the 21-ema.
While on the other hand a stock in a downtrend that is underperforming will see a negative red histogram a red histogram signifying the RS line is below the 21-ema.
On top of all of that, the indicator also keeps 3 & 13 exponential moving average of the distance between the RS line and the 21 ema to help identify shorter term relative strength and capture more immediate shifts in momentum. Both of those are plotted on the histogram as well and will change color as they rise and fall making it easy to spot the direction.
Indicator options include:
- Choose symbol to measure performance against
- Change histogram colors
- Choose ema line width
* Note this indicator does not plot the actual RS line, it is the histogram representing the distance between the RS line calculated using the lows and the 21 ema, as well as the two ema's of the relationship.
Sürüm Notları
Update the name of the ema plots.Açık kaynak kodlu komut dosyası
Gerçek TradingView ruhuyla, bu komut dosyasının mimarı, yatırımcıların işlevselliğini inceleyip doğrulayabilmesi için onu açık kaynaklı hale getirdi. Yazarı tebrik ederiz! Ücretsiz olarak kullanabilseniz de, kodu yeniden yayınlamanın Topluluk Kurallarımıza tabi olduğunu unutmayın.
Trusted Pine programmer. Send me a message for script development.
Feragatname
Bilgiler ve yayınlar, TradingView tarafından sağlanan veya onaylanan finansal, yatırım, alım satım veya diğer türden tavsiye veya öneriler anlamına gelmez ve teşkil etmez. Kullanım Koşulları bölümünde daha fazlasını okuyun.
Açık kaynak kodlu komut dosyası
Gerçek TradingView ruhuyla, bu komut dosyasının mimarı, yatırımcıların işlevselliğini inceleyip doğrulayabilmesi için onu açık kaynaklı hale getirdi. Yazarı tebrik ederiz! Ücretsiz olarak kullanabilseniz de, kodu yeniden yayınlamanın Topluluk Kurallarımıza tabi olduğunu unutmayın.
Trusted Pine programmer. Send me a message for script development.
Feragatname
Bilgiler ve yayınlar, TradingView tarafından sağlanan veya onaylanan finansal, yatırım, alım satım veya diğer türden tavsiye veya öneriler anlamına gelmez ve teşkil etmez. Kullanım Koşulları bölümünde daha fazlasını okuyun.