OPEN-SOURCE SCRIPT
Güncellendi StochCMO - Stochastic CMO [SHK]
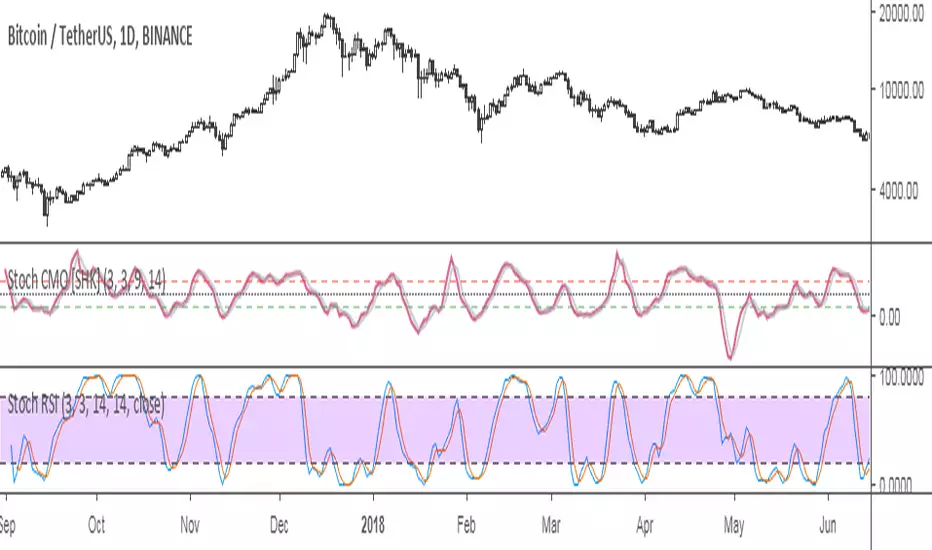
StochCMO is the combination of Stochastic and CMO (Chande Momentum Oscillator).
The StochCMO is an indicator used in technical analysis that ranges between zero and one and is created by applying the Stochastic Oscillator formula to a set of Chande Momentum Oscillator (CMO) values rather than standard price data. Using CMO values within the Stochastic formula gives traders an idea of whether the current CMO value is overbought or oversold - a measure that becomes specifically useful when the CMO value is confined between its signal levels of 20 and 80.
Usage:
The usage of StochCMO is similar to StochRSI.
StochCMO vs StochRSI:
The difference between these indicators can be realized by comparing CMO & RSI:
CMO is similar to the Relative Strength Index (RSI) except that it measures momentum on both up days and down days. The CMO also does not use internal smoothing and thus does not obscure short-term extremes in momentum. As a result, the CMO often reaches over bought and over sold areas more regularly than momentum indicators, such as the RSI, that have internal smoothing.
Hope it helps you.
Sürüm Notları
New Source CodeAçık kaynak kodlu komut dosyası
Gerçek TradingView ruhuyla, bu komut dosyasının mimarı, yatırımcıların işlevselliğini inceleyip doğrulayabilmesi için onu açık kaynaklı hale getirdi. Yazarı tebrik ederiz! Ücretsiz olarak kullanabilseniz de, kodu yeniden yayınlamanın Topluluk Kurallarımıza tabi olduğunu unutmayın.
Feragatname
Bilgiler ve yayınlar, TradingView tarafından sağlanan veya onaylanan finansal, yatırım, alım satım veya diğer türden tavsiye veya öneriler anlamına gelmez ve teşkil etmez. Kullanım Koşulları bölümünde daha fazlasını okuyun.
Açık kaynak kodlu komut dosyası
Gerçek TradingView ruhuyla, bu komut dosyasının mimarı, yatırımcıların işlevselliğini inceleyip doğrulayabilmesi için onu açık kaynaklı hale getirdi. Yazarı tebrik ederiz! Ücretsiz olarak kullanabilseniz de, kodu yeniden yayınlamanın Topluluk Kurallarımıza tabi olduğunu unutmayın.
Feragatname
Bilgiler ve yayınlar, TradingView tarafından sağlanan veya onaylanan finansal, yatırım, alım satım veya diğer türden tavsiye veya öneriler anlamına gelmez ve teşkil etmez. Kullanım Koşulları bölümünde daha fazlasını okuyun.