OPEN-SOURCE SCRIPT
Güncellendi RSI with Close & Tail Divergences

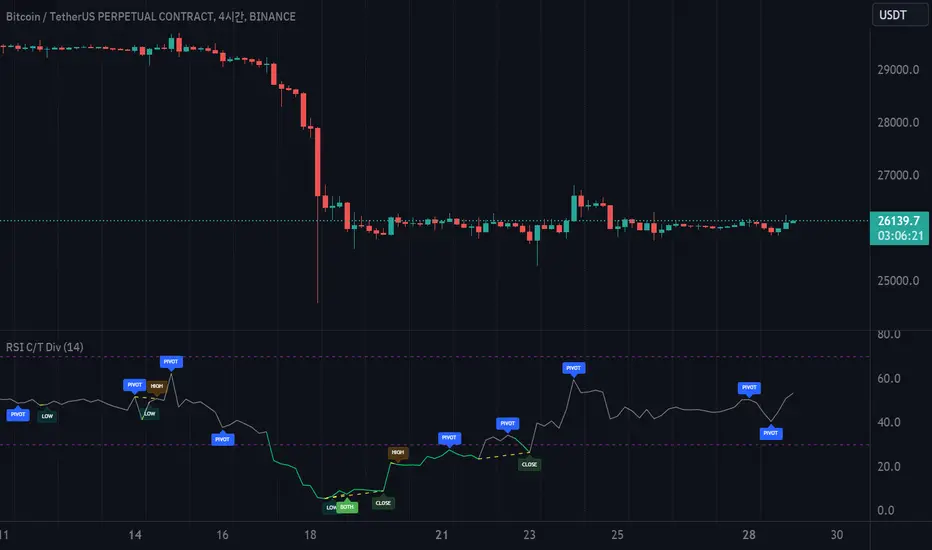
RSI divergence is a cornerstone signal for both stock and cryptocurrency traders, renowned for its reliability.
The basis for measuring divergence can vary:
Depending on the criteria selected, the resultant signals can be markedly different.
Our innovative indicator offers:
With this tool, traders are empowered to make informed decisions, anchored in precise divergence cues.
This indicator boasts the following capabilities:

The basis for measuring divergence can vary:
- Historically, it's been determined by the candlestick's closing price.
- However, a contemporary approach uses the tail values, specifically the high and low prices, of the candlestick.
Depending on the criteria selected, the resultant signals can be markedly different.
Our innovative indicator offers:
- Divergence tracking based on the closing price of the candlestick.
- Divergence tracking considering the candlestick's peak and trough values.
- A unique convergence of both types of divergence signals.
With this tool, traders are empowered to make informed decisions, anchored in precise divergence cues.
This indicator boasts the following capabilities:
- Displays divergence based on closing price, highs/lows, as well as a unique combined criterion.
- Highlights pivot points.
- Denotes divergence spots on the RSI chart with lines.
- Offers a background color representation instead of labels.
Sürüm Notları
RSI divergence is a cornerstone signal for both stock and cryptocurrency traders, renowned for its reliability.The basis for measuring divergence can vary:
- Historically, it's been determined by the candlestick's closing price.
- However, a contemporary approach uses the tail values, specifically the high and low prices, of the candlestick.
Depending on the criteria selected, the resultant signals can be markedly different.
Our innovative indicator offers:
- Divergence tracking based on the closing price of the candlestick.
- Divergence tracking considering the candlestick's peak and trough values.
- A unique convergence of both types of divergence signals.
With this tool, traders are empowered to make informed decisions, anchored in precise divergence cues.
This indicator boasts the following capabilities:
- Displays divergence based on closing price, highs/lows, as well as a unique combined criterion.
- Highlights pivot points.
- Denotes divergence spots on the RSI chart with lines.
- Offers a background color representation instead of labels.
Açık kaynak kodlu komut dosyası
Gerçek TradingView ruhuyla, bu komut dosyasının mimarı, yatırımcıların işlevselliğini inceleyip doğrulayabilmesi için onu açık kaynaklı hale getirdi. Yazarı tebrik ederiz! Ücretsiz olarak kullanabilseniz de, kodu yeniden yayınlamanın Topluluk Kurallarımıza tabi olduğunu unutmayın.
Feragatname
Bilgiler ve yayınlar, TradingView tarafından sağlanan veya onaylanan finansal, yatırım, alım satım veya diğer türden tavsiye veya öneriler anlamına gelmez ve teşkil etmez. Kullanım Koşulları bölümünde daha fazlasını okuyun.