OPEN-SOURCE SCRIPT
Güncellendi AntoQQE - Bars
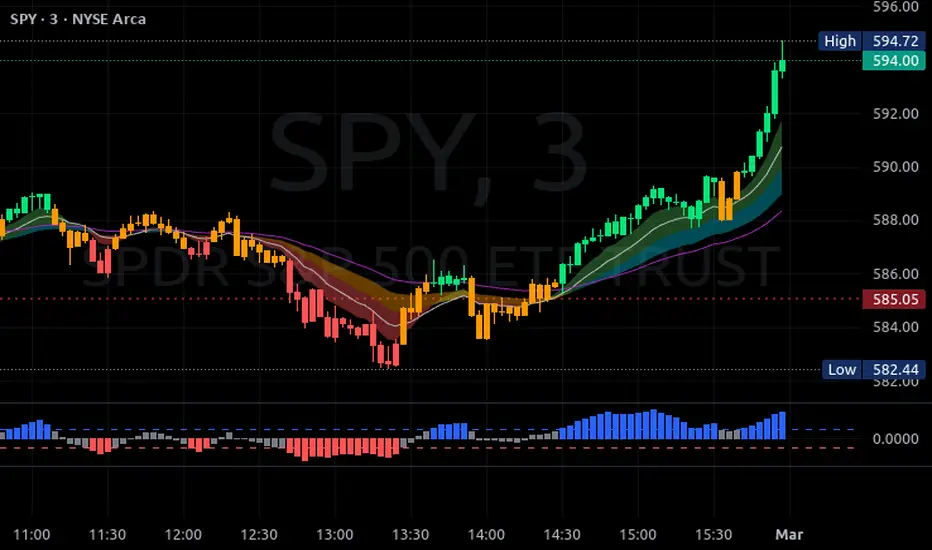
This script is a variation on the QQE (Quantitative Qualitative Estimation) concept applied to RSI. It calculates a smoothed RSI line, then determines a “Dynamic Average Range” around that line. By tracking the RSI’s movement relative to these upper (shortBand) and lower (longBand) levels, it determines when price momentum shifts enough to suggest a possible trend flip. The script plots color-coded candles based on these momentum conditions:
• RSI Calculation and Smoothing
An RSI value is obtained over a specified period, then smoothed by an EMA. This smoothed RSI serves as the core measure of momentum.
• Dynamic Average Range (DAR)
The script computes the volatility of the smoothed RSI using two EMAs of its bar-to-bar movements. It multiplies this volatility factor by a QQE multiplier to create upper and lower bands that adapt to changes in RSI volatility.
• Trend Flips
When the smoothed RSI crosses above or below its previous band level (shortBand or longBand), the script interprets this as a shift in momentum and sets a trend state accordingly (long or short).
• Candle Coloring
Finally, the script colors each candle according to how far the smoothed RSI is from a neutral baseline of 50:
Candles turn green when the RSI is sufficiently above 50, suggesting bullish momentum.
Candles turn red when the RSI is sufficiently below 50, indicating bearish momentum.
Candles turn orange when they are near the 50 level, reflecting a more neutral or transitional phase.
Traders can use these colored candles to quickly see when the RSI’s momentum has moved into overbought/oversold zones—or is shifting between bullish and bearish conditions—without needing to consult a separate oscillator window. The adaptive nature of the band calculations can help in spotting significant shifts in market sentiment and volatility.
Sürüm Notları
This script is a variation on the QQE (Quantitative Qualitative Estimation) concept applied to RSI. It calculates a smoothed RSI line, then determines a “Dynamic Average Range” around that line. By tracking the RSI’s movement relative to these upper (shortBand) and lower (longBand) levels, it determines when price momentum shifts enough to suggest a possible trend flip. The script plots color-coded candles based on these momentum conditions:• RSI Calculation and Smoothing
An RSI value is obtained over a specified period, then smoothed by an EMA. This smoothed RSI serves as the core measure of momentum.
• Dynamic Average Range (DAR)
The script computes the volatility of the smoothed RSI using two EMAs of its bar-to-bar movements. It multiplies this volatility factor by a QQE multiplier to create upper and lower bands that adapt to changes in RSI volatility.
• Trend Flips
When the smoothed RSI crosses above or below its previous band level (shortBand or longBand), the script interprets this as a shift in momentum and sets a trend state accordingly (long or short).
• Candle Coloring
Finally, the script colors each candle according to how far the smoothed RSI is from a neutral baseline of 50:
Candles turn green when the RSI is sufficiently above 50, suggesting bullish momentum.
Candles turn red when the RSI is sufficiently below 50, indicating bearish momentum.
Candles turn orange when they are near the 50 level, reflecting a more neutral or transitional phase.
Traders can use these colored candles to quickly see when the RSI’s momentum has moved into overbought/oversold zones—or is shifting between bullish and bearish conditions—without needing to consult a separate oscillator window, though the oscillator is available under AntoQQE - Histogram. The adaptive nature of the band calculations can help in spotting significant shifts in market sentiment and volatility.
Açık kaynak kodlu komut dosyası
Gerçek TradingView ruhuyla, bu komut dosyasının mimarı, yatırımcıların işlevselliğini inceleyip doğrulayabilmesi için onu açık kaynaklı hale getirdi. Yazarı tebrik ederiz! Ücretsiz olarak kullanabilseniz de, kodu yeniden yayınlamanın Topluluk Kurallarımıza tabi olduğunu unutmayın.
Feragatname
Bilgiler ve yayınlar, TradingView tarafından sağlanan veya onaylanan finansal, yatırım, alım satım veya diğer türden tavsiye veya öneriler anlamına gelmez ve teşkil etmez. Kullanım Koşulları bölümünde daha fazlasını okuyun.