OPEN-SOURCE SCRIPT
Güncellendi Disguised Candles by The School of Dalal Street
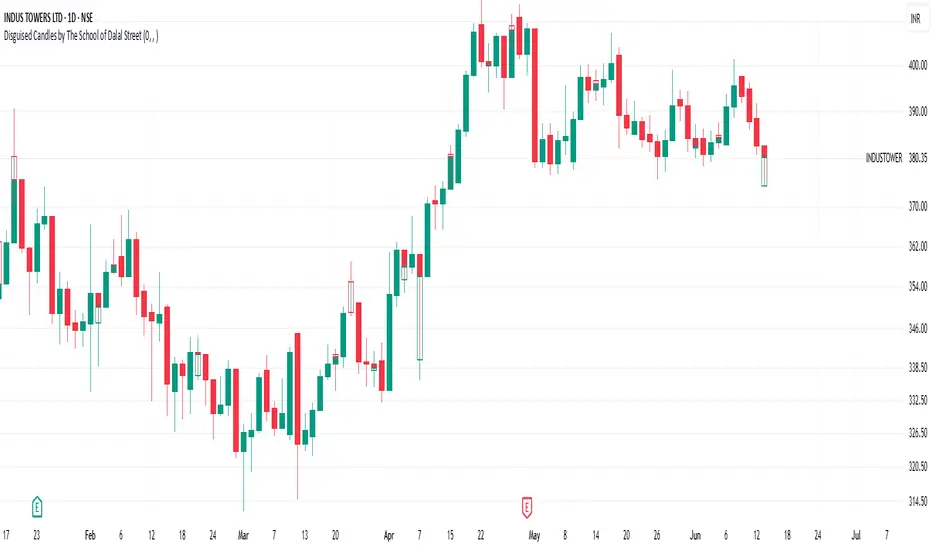
Disguised Candles corrects one of the subtle visual distortions present in normal candlestick charts — the mismatch between the close of one candle and the open of the next.
On many instruments (especially at day/session breaks), the next candle’s open often jumps due to price gaps or data feed behavior. This can make reading the flow of price action harder than necessary.
Disguised Candles fixes this by plotting synthetic candles where the open of each candle is forced to match the close of the previous one — creating a visually continuous flow of price.
Real candles are made fully transparent, so only the "corrected" candles are visible.
This allows traders to:
Visualize price flow as a smooth path
Better spot true directional shifts and trends
Avoid distractions caused by technical gaps that are not meaningful to their strategy
🚀 Pure visual clarity. No noise from false opens.
How it works:
The open of each synthetic candle = close of previous real candle
High, Low, Close remain unchanged
Colors are based on Close vs Corrected Open
Real chart candles are hidden under a transparent overlay
Use this as a clean canvas for trend analysis or as a foundation for building new visual systems.
Sürüm Notları
Disguised Candles corrects one of the subtle visual distortions present in normal candlestick charts — the mismatch between the close of one candle and the open of the next.On many instruments (especially at day/session breaks), the next candle’s open often jumps due to price gaps or data feed behavior. This can make reading the flow of price action harder than necessary.
Disguised Candles fixes this by plotting synthetic candles where the open of each candle is forced to match the close of the previous one — creating a visually continuous flow of price.
Real candles are made fully transparent, so only the "corrected" candles are visible.
This allows traders to:
Visualize price flow as a smooth path
Better spot true directional shifts and trends
Avoid distractions caused by technical gaps that are not meaningful to their strategy
🚀 Pure visual clarity. No noise from false opens.
How it works:
The open of each synthetic candle = close of previous real candle
High, Low, Close remain unchanged
Colors are based on Close vs Corrected Open
Real chart candles are hidden under a transparent overlay
Use this as a clean canvas for trend analysis or as a foundation for building new visual systems.
Sürüm Notları
Corrected bug which showed original disguised candle in cases where the corrected candle color changed.Important: To use this indicator properly, disable the original Tradingview candles, by going into Chart Settings > Symbol and unchecking the Body, Wick and Border.
Sürüm Notları
Fixed candles where if the corrected candle color changed, both were visible, causing confusion.Açık kaynak kodlu komut dosyası
Gerçek TradingView ruhuyla, bu komut dosyasının mimarı, yatırımcıların işlevselliğini inceleyip doğrulayabilmesi için onu açık kaynaklı hale getirdi. Yazarı tebrik ederiz! Ücretsiz olarak kullanabilseniz de, kodu yeniden yayınlamanın Topluluk Kurallarımıza tabi olduğunu unutmayın.
Feragatname
Bilgiler ve yayınlar, TradingView tarafından sağlanan veya onaylanan finansal, yatırım, alım satım veya diğer türden tavsiye veya öneriler anlamına gelmez ve teşkil etmez. Kullanım Koşulları bölümünde daha fazlasını okuyun.
Açık kaynak kodlu komut dosyası
Gerçek TradingView ruhuyla, bu komut dosyasının mimarı, yatırımcıların işlevselliğini inceleyip doğrulayabilmesi için onu açık kaynaklı hale getirdi. Yazarı tebrik ederiz! Ücretsiz olarak kullanabilseniz de, kodu yeniden yayınlamanın Topluluk Kurallarımıza tabi olduğunu unutmayın.
Feragatname
Bilgiler ve yayınlar, TradingView tarafından sağlanan veya onaylanan finansal, yatırım, alım satım veya diğer türden tavsiye veya öneriler anlamına gelmez ve teşkil etmez. Kullanım Koşulları bölümünde daha fazlasını okuyun.