OPEN-SOURCE SCRIPT
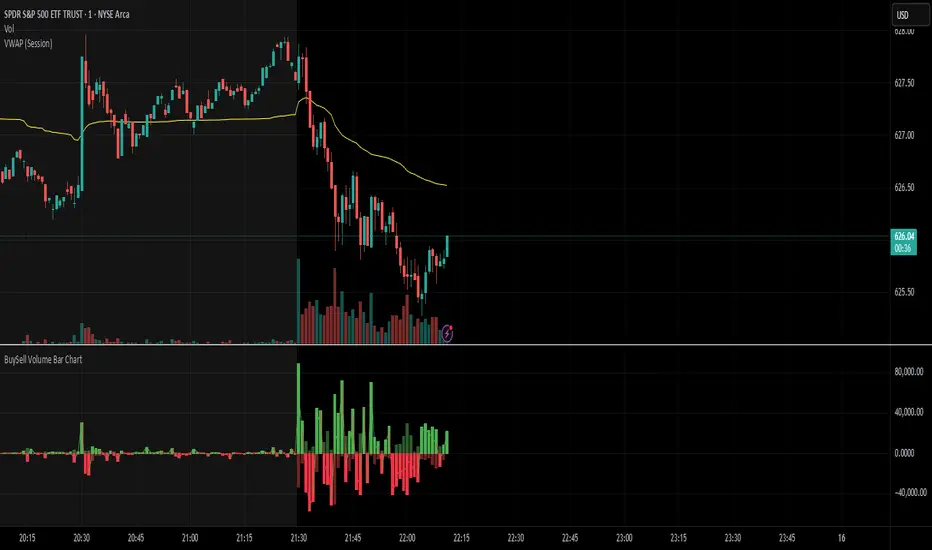
BuySell Volume Bar Chart

• Separates estimated Buy and Sell volume per bar using price action logic
• Plots them in a dual-axis format: buy volume goes up, sell volume goes down
• Colors are dynamic — whichever side dominates gets the stronger color, the weaker side is shaded
• Includes a live difference metric (Δ Volume) as a third value in the indicator title
• Automatically filters out flat/no-move bars to avoid misleading spikes
The live difference metric ("Δ Volume") can be controlled.
This metric calculates the difference between the buying and selling volume live, where it takes the Buy Volume - Sell Volume.
This difference is then displayed in either green (BV > SV) or red (SV > BV). You can toggle it on/off by entering the indicator's settings or double tapping the indicator name on the TV chart.
Another pretty cool thing is the modular colors - you can customize your candle colors and shades to your liking within the code!
Açık kaynak kodlu komut dosyası
Gerçek TradingView ruhuyla, bu komut dosyasının mimarı, yatırımcıların işlevselliğini inceleyip doğrulayabilmesi için onu açık kaynaklı hale getirdi. Yazarı tebrik ederiz! Ücretsiz olarak kullanabilseniz de, kodu yeniden yayınlamanın Topluluk Kurallarımıza tabi olduğunu unutmayın.
Feragatname
Bilgiler ve yayınlar, TradingView tarafından sağlanan veya onaylanan finansal, yatırım, alım satım veya diğer türden tavsiye veya öneriler anlamına gelmez ve teşkil etmez. Kullanım Koşulları bölümünde daha fazlasını okuyun.