OPEN-SOURCE SCRIPT
Güncellendi SuperTrend + Relative Volume (Kernel Optimized)

Introducing our new KDE Optimized Supertrend + Relative Volume Indicator!
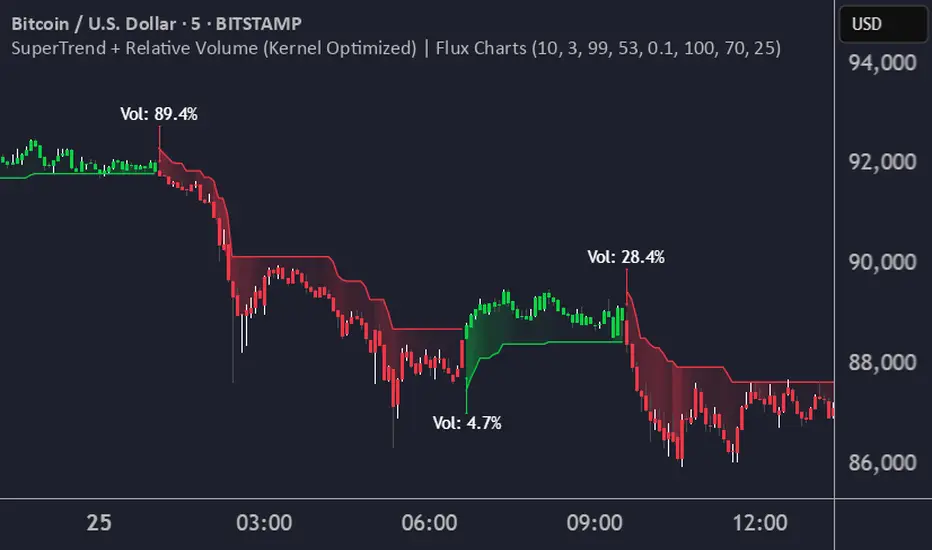
This innovative indicator combines the power of the Supertrend indicator along with Relative Volume. It utilizes the Kernel Density Estimation (KDE) to estimate the probability of a candlestick marking a significant trend break or reversal.
❓How to Interpret the KDE %:
The KDE % is a crucial metric that reflects the likelihood that the current candlestick represents a true break in the SuperTrend line, supported by an increase in relative volume. It estimates the probability of a trend shift or continuation based on historical SuperTrend breaks and volume patterns:
Low KDE %: A lower probability that the current break is significant. Price action is less likely to reverse, and the trend may continue.
Moderate KDE - High KDE %: An increased possibility that a trend reversal or consolidation could occur. Traders should start watching for confirmation signals.
📌How Does It Work?
The SuperTrend indicator uses the Average True Range (ATR) to determine the direction of the trend and identifies when the price crosses the SuperTrend line, signaling a potential trend reversal. Here's how the KDE Optimized SuperTrend Indicator works:
⚙️Settings:
SuperTrend Settings:
KDE Settings:
This innovative indicator combines the power of the Supertrend indicator along with Relative Volume. It utilizes the Kernel Density Estimation (KDE) to estimate the probability of a candlestick marking a significant trend break or reversal.
❓How to Interpret the KDE %:
The KDE % is a crucial metric that reflects the likelihood that the current candlestick represents a true break in the SuperTrend line, supported by an increase in relative volume. It estimates the probability of a trend shift or continuation based on historical SuperTrend breaks and volume patterns:
Low KDE %: A lower probability that the current break is significant. Price action is less likely to reverse, and the trend may continue.
Moderate KDE - High KDE %: An increased possibility that a trend reversal or consolidation could occur. Traders should start watching for confirmation signals.
📌How Does It Work?
The SuperTrend indicator uses the Average True Range (ATR) to determine the direction of the trend and identifies when the price crosses the SuperTrend line, signaling a potential trend reversal. Here's how the KDE Optimized SuperTrend Indicator works:
- SuperTrend Calculation: The SuperTrend indicator is calculated, and when the price breaks above (bullish) or below (bearish) the SuperTrend line, it is logged as a significant event.
- Relative Volume: For each break in the SuperTrend line, we calculate the relative volume (current volume vs. the average volume over a defined period). High relative volume can suggest stronger confirmation of the trend break.
- KDE Array Calculation: KDE is applied to the break points and relative volume data:
- Define the KDE options: Bandwidth, Number of Steps, and Array Range (Array Max - Array Min).
- Create a density range array using the defined number of steps, corresponding to potential break points.
- Apply a Gaussian kernel function to the break points and volume data to estimate the likelihood of the trend break being significant.
- KDE Value and Signal Generation: The KDE array is updated as each break occurs. The KDE % is calculated for the breakout candlestick, representing the likelihood of the trend break being significant. If the KDE value exceeds the defined activation threshold, a darker bullish or bearish arrow is plotted after bar confirmation. If the KDE value falls below the threshold, a more transparent arrow is drawn, indicating a possible but lower probability break.
⚙️Settings:
SuperTrend Settings:
- ATR Length: The period over which the Average True Range (ATR) is calculated.
- Multiplier: The multiplier applied to the ATR to determine the SuperTrend threshold.
KDE Settings:
- Bandwidth: Determines the smoothness of the KDE function and the width of the influence of each break point.
- Number of Bins (Steps): Defines the precision of the KDE algorithm, with higher values offering more detailed calculations.
- KDE Threshold %: The level at which relative volume is considered significant for confirming a break.
- Relative Volume Length: The number of historic candles used in calculating KDE %
Sürüm Notları
Updated KDE LimitSürüm Notları
Updated default settings to improve ease of use Sürüm Notları
Split the KDE in two for bullish and bearish signals. Bullish and Bearish KDE's now use buy and sell volume respectively. Sürüm Notları
Refactoring + update signal conditionsSürüm Notları
- Updated recalculation period
- Volume calculation logic to use a average ratio
Sürüm Notları
Swapped ratio for sell volumeSürüm Notları
Added KDE percent based gradient for fill colorSürüm Notları
Add setting to disable KDE percentage text Sürüm Notları
- Added trend coloring
- Added setting to disable display of SuperTrend Line
- Added setting to disable display of SuperTrend fill gradient
- Updated threshold activation setting to be used as an additional condition to trigger a directional change
Açık kaynak kodlu komut dosyası
Gerçek TradingView ruhuyla, bu komut dosyasının mimarı, yatırımcıların işlevselliğini inceleyip doğrulayabilmesi için onu açık kaynaklı hale getirdi. Yazarı tebrik ederiz! Ücretsiz olarak kullanabilseniz de, kodu yeniden yayınlamanın Topluluk Kurallarımıza tabi olduğunu unutmayın.
Access Flux Charts' exclusive indicators: fluxcharts.com/
Join our Discord community: discord.gg/FluxCharts
Join our Discord community: discord.gg/FluxCharts
Feragatname
Bilgiler ve yayınlar, TradingView tarafından sağlanan veya onaylanan finansal, yatırım, alım satım veya diğer türden tavsiye veya öneriler anlamına gelmez ve teşkil etmez. Kullanım Koşulları bölümünde daha fazlasını okuyun.