PROTECTED SOURCE SCRIPT
Güncellendi Support and Resistance Lines [Swastik]

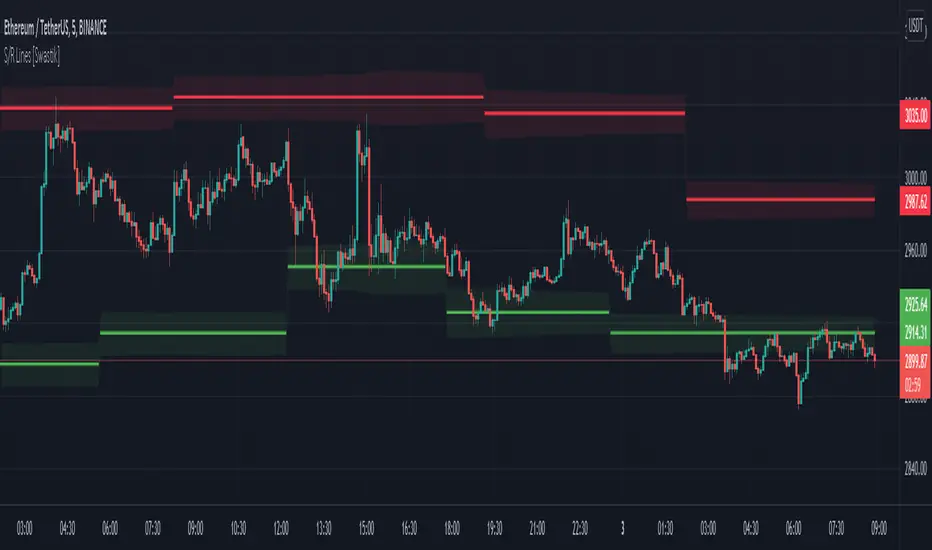
This indicator plots support and resistance lines automatically on the basis of the pivots created by the swings in the market.
You can increase the swing sensitivity if you want it to detect only larger swings.
There is a range drawn around the support and resistance lines based on the volatility of the market.
This works on every timeframe and the lines are drawn on the basis of swings in that timeframe.
This does not repaints and you can use it freely.
Sürüm Notları
Added the alert conditions for crossing of the Support and Resistance LinesKorumalı komut dosyası
Bu komut dosyası kapalı kaynak olarak yayınlanmaktadır. Ancak, ücretsiz ve herhangi bir sınırlama olmaksızın kullanabilirsiniz – daha fazla bilgiyi buradan edinebilirsiniz.
Feragatname
Bilgiler ve yayınlar, TradingView tarafından sağlanan veya onaylanan finansal, yatırım, alım satım veya diğer türden tavsiye veya öneriler anlamına gelmez ve teşkil etmez. Kullanım Koşulları bölümünde daha fazlasını okuyun.
Korumalı komut dosyası
Bu komut dosyası kapalı kaynak olarak yayınlanmaktadır. Ancak, ücretsiz ve herhangi bir sınırlama olmaksızın kullanabilirsiniz – daha fazla bilgiyi buradan edinebilirsiniz.
Feragatname
Bilgiler ve yayınlar, TradingView tarafından sağlanan veya onaylanan finansal, yatırım, alım satım veya diğer türden tavsiye veya öneriler anlamına gelmez ve teşkil etmez. Kullanım Koşulları bölümünde daha fazlasını okuyun.