OPEN-SOURCE SCRIPT
Güncellendi MTF Phoenix Table
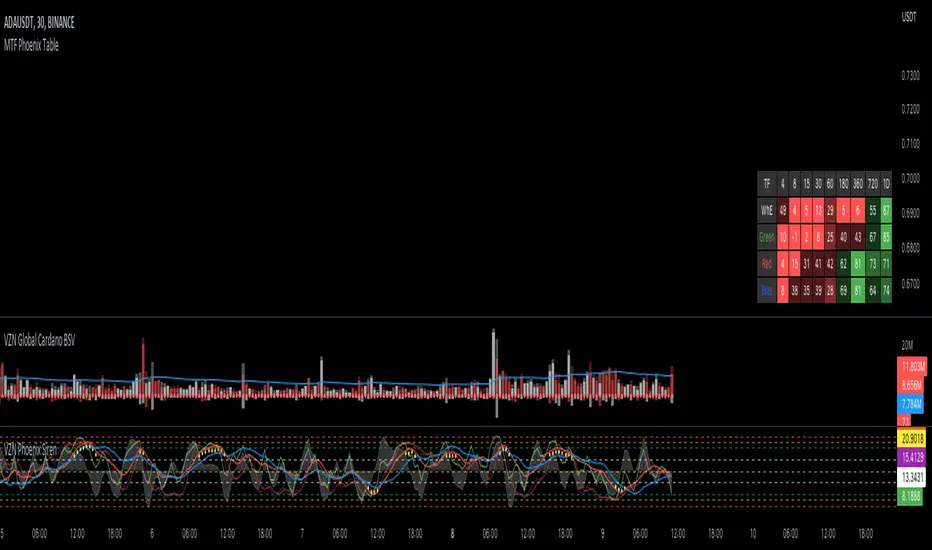
This is a MTF heatmap companion for the Phoenix Ascending indicator by WyckoffMode. It aims to make MTF analysis easier at a quick glance.
The row headings are color coordinated for easy visual recognition.
The row headings are color coordinated for easy visual recognition.
Sürüm Notları
I have updated the table so that if a Phoenix Indicator Value in any time frame is currently trending down (relative to the previous bar) the text color in that cell will be fuchsia. Also I made a slight adjustment to two transparency levels for < 50 to help distinguish between them.
Sürüm Notları
I reverted the text color change because it seems to have a bug. When the current chart timeframe is higher than the minimum timeframe in the table it doesn't always correctly call if the cell value is rising or falling.Sürüm Notları
I was able to discover a fix so the table updated correctly and color the text correctly based on if the current cell value was less than the previous value. The text color that represents a descending value is yellow.Sürüm Notları
Cell text color error removedSürüm Notları
As requested by some, I have adjusted the code so that the timeframes in the settings are adjustable and effect the TF header accordingly. All values under the daily will be expressed in minutes, e.g. 12H = 720.Açık kaynak kodlu komut dosyası
Gerçek TradingView ruhuyla, bu komut dosyasının mimarı, yatırımcıların işlevselliğini inceleyip doğrulayabilmesi için onu açık kaynaklı hale getirdi. Yazarı tebrik ederiz! Ücretsiz olarak kullanabilseniz de, kodu yeniden yayınlamanın Topluluk Kurallarımıza tabi olduğunu unutmayın.
Feragatname
Bilgiler ve yayınlar, TradingView tarafından sağlanan veya onaylanan finansal, yatırım, alım satım veya diğer türden tavsiye veya öneriler anlamına gelmez ve teşkil etmez. Kullanım Koşulları bölümünde daha fazlasını okuyun.
Açık kaynak kodlu komut dosyası
Gerçek TradingView ruhuyla, bu komut dosyasının mimarı, yatırımcıların işlevselliğini inceleyip doğrulayabilmesi için onu açık kaynaklı hale getirdi. Yazarı tebrik ederiz! Ücretsiz olarak kullanabilseniz de, kodu yeniden yayınlamanın Topluluk Kurallarımıza tabi olduğunu unutmayın.
Feragatname
Bilgiler ve yayınlar, TradingView tarafından sağlanan veya onaylanan finansal, yatırım, alım satım veya diğer türden tavsiye veya öneriler anlamına gelmez ve teşkil etmez. Kullanım Koşulları bölümünde daha fazlasını okuyun.