OPEN-SOURCE SCRIPT
Güncellendi Multi-timeframe Stochastic RSI
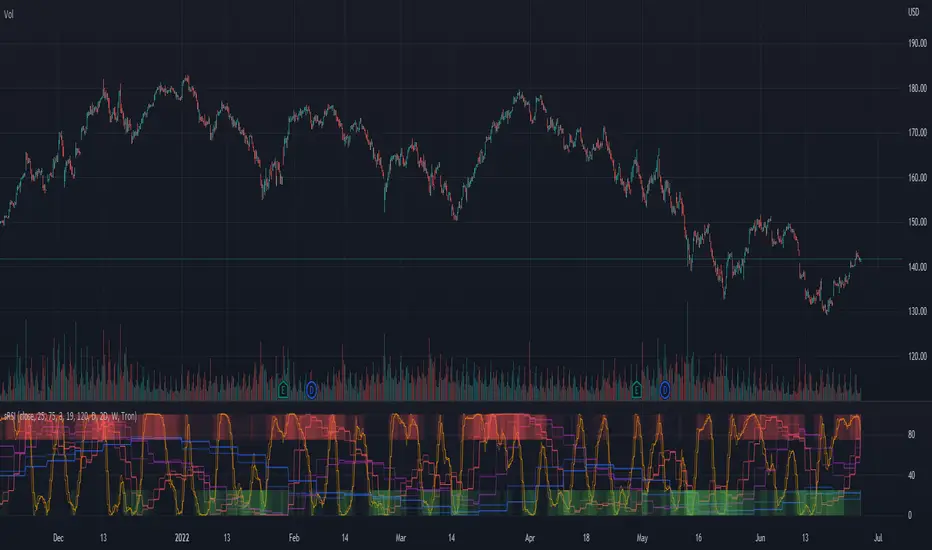
The multi-timeframe stochastic RSI utilizes stochastic RSI signals from 11 different time-frames to indicate whether overbought/oversold signals are in agreement or not across time-frames. Ideally traders should enter and exit when conditions are in agreement as indicated by the intensity of the long (green) or short (red) bands at the top and bottom of the indicator. The intensity of the bands indicates how many of the time-frames are currently overbought/oversold.
Sürüm Notları
Updated script so that it auto adjust to the chart time-frame. Sürüm Notları
Script now auto-adjusts the time-frames used in the oversold and overbought regions as well as the time-frames displayed to the timeframe of the chart.Selecting "manual sRSI" allows you to adjust the time-frames displayed, but not the timeframes used for the oversold and overbought regions.
Selecting "I have free TV" adjusts the chart to only use the basic timeframes.
Minor edits to retain original functionality: Select "I have free TV" and "Manual sRSI" for v1 behavior.
Açık kaynak kodlu komut dosyası
Gerçek TradingView ruhuyla, bu komut dosyasının mimarı, yatırımcıların işlevselliğini inceleyip doğrulayabilmesi için onu açık kaynaklı hale getirdi. Yazarı tebrik ederiz! Ücretsiz olarak kullanabilseniz de, kodu yeniden yayınlamanın Topluluk Kurallarımıza tabi olduğunu unutmayın.
Feragatname
Bilgiler ve yayınlar, TradingView tarafından sağlanan veya onaylanan finansal, yatırım, alım satım veya diğer türden tavsiye veya öneriler anlamına gelmez ve teşkil etmez. Kullanım Koşulları bölümünde daha fazlasını okuyun.