Ekambit Volume Strength Index (EVSI)
We at Ekambit Technologies use it daily, together with ESI indicator, with consistent success in the Indian and US markets.
This indicator is effective for intraday timeframes as we have backtested as well as deployed on the live market.
Usage:
1) Green & above mid-zone & rising: uptrend
2) Green & falling from high-zone: uptrend reversal
3) Red & below mid-zone & falling: downtrend
4) Red & rising from low-zone: downtrend reversal
5) Blue: transition middle-zone (wait to enter, or exit on opportunity)
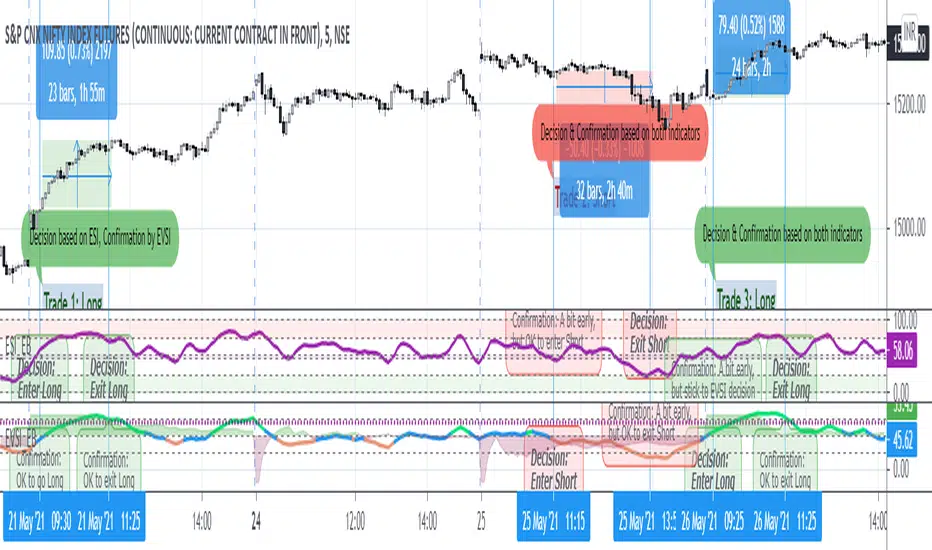
For greater conviction before entering a trade, enable the "Show Trend" option, which compares recent volume strength with long-term historical volume strength.
For the above example,
* The purple dotted line (around 65) shows the long term historical volume trend strength.
* The green shaded area indicates that current volume trend strength is around 5% stronger than historical, which should provide greater conviction to the direction shown by EVSI indicator. This delta (recent minus historical) is shown with a base of 50, to align with the middle line of EVSI and provide you with an easy visually perceptible output.
Learning:
Just like price has memory, volume has memory. Volume indicates the collective outcome of all market participants. A larger number of participants makes it easier to predict the volume trend in a probabilistic manner.
Hence Index Futures like
For Futures which trade almost 24x7, it's better to choose the high volume time periods i.e. when local Equity market is Open, rather than the overnight illiquid time periods.
- Improved EVSI calculation
- Showcase latest example from 28-May-2021
- Show EVSI usage together with ESI indicator, for a stronger conviction for entering and exiting trades
Yalnızca davetli komut dosyası
Bu komut dosyasına yalnızca yazar tarafından onaylanan kullanıcılar erişebilir. Kullanmak için izin istemeniz ve almanız gerekir. Bu genellikle ödeme yapıldıktan sonra verilir. Daha fazla ayrıntı için aşağıdaki yazarın talimatlarını izleyin veya doğrudan ekambit ile iletişime geçin.
TradingView, yazarına tamamen güvenmediğiniz ve nasıl çalıştığını anlamadığınız sürece bir komut dosyası için ödeme yapmanızı veya kullanmanızı TAVSİYE ETMEZ. Ayrıca topluluk komut dosyalarımızda ücretsiz, açık kaynaklı alternatifler bulabilirsiniz.
Yazarın talimatları
Feragatname
Yalnızca davetli komut dosyası
Bu komut dosyasına yalnızca yazar tarafından onaylanan kullanıcılar erişebilir. Kullanmak için izin istemeniz ve almanız gerekir. Bu genellikle ödeme yapıldıktan sonra verilir. Daha fazla ayrıntı için aşağıdaki yazarın talimatlarını izleyin veya doğrudan ekambit ile iletişime geçin.
TradingView, yazarına tamamen güvenmediğiniz ve nasıl çalıştığını anlamadığınız sürece bir komut dosyası için ödeme yapmanızı veya kullanmanızı TAVSİYE ETMEZ. Ayrıca topluluk komut dosyalarımızda ücretsiz, açık kaynaklı alternatifler bulabilirsiniz.