Diabolicus

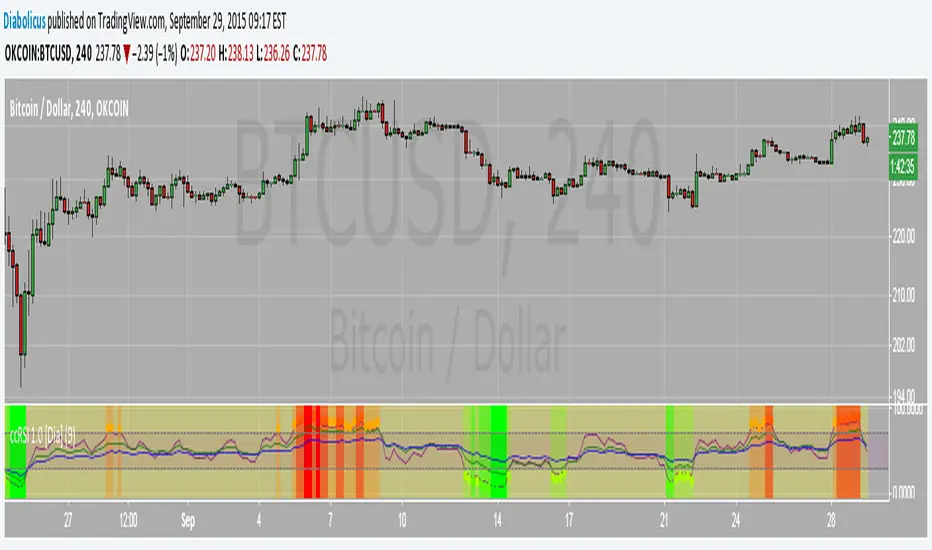
color-coded Relative Strength Index

color coded RSI that looks at larger time frame RSIs for confirmation (2 times and 4 times the selected RSI length).
Açık kaynak kodlu komut dosyası

Gerçek TradingView ruhuyla, bu betiğin yazarı, yatırımcının anlayabilmesi ve doğrulayabilmesi için onu açık kaynak olarak yayınladı. Yazarın eline sağlık! Bunu ücretsiz olarak kullanabilirsiniz, ancak bu kodun bir yayında yeniden kullanımı Kullanım Koşulları ile yönetilir. Bir grafikte kullanmak için favorilere ekleyebilirsiniz.

Feragatname

Bilgiler ve yayınlar, TradingView tarafından sağlanan veya onaylanan finansal, yatırım, işlem veya diğer türden tavsiye veya tavsiyeler anlamına gelmez ve teşkil etmez. Kullanım Şartları'nda daha fazlasını okuyun.

Bu komut dosyasını bir grafikte kullanmak ister misiniz?
study(title="color-coded Relative Strength Index", shorttitle="ccRSI 1.0 [Dia]")
src_1 = ohlc4
len_1 = input(9, minval=1, title="Length")
len_2 = 2*len_1
len_3 = 2*len_2
get_rsi(src,len)=>
    up = rma(max(change(src), 0), len)
    down = rma(-min(change(src), 0), len)
    rsi = down == 0 ? 100 : up == 0 ? 0 : 100 - (100 / (1 + up / down))
rsi_1 = get_rsi(src_1,len_1)
rsi_2 = get_rsi(src_1,len_2)
rsi_3 = get_rsi(src_1,len_3)

plot(rsi_1, color=purple)
plot(rsi_2, color=green)
plot(rsi_3, color=blue)
band1 = hline(70)
band0 = hline(30)
fill(band1, band0, color=purple, transp=90)
sent_1 = rsi_1
sent_2 = rsi_1 > 70 or rsi_1 < 30 ? rsi_2 < 30 ? -(30-rsi_2)/2 :  rsi_2 > 70 ? (rsi_2-70)/2 : 0 : 0
sent_3 = rsi_1 > 70 or rsi_1 < 30 ? rsi_3 < 30 ? -(30-rsi_3)/2 :  rsi_3 > 70 ? (rsi_3-70)/2 : 0 : 0
sent = 100-(sent_1 + sent_2 + sent_3)
col01 = sent                <=  10 ? 1 : 0
col02 = sent >  10 and sent <=  20 ? 1 : 0
col03 = sent >  20 and sent <=  30 ? 1 : 0
col04 = sent >  30 and sent <   70 ? 1 : 0
col05 = sent >= 70 and sent <   80 ? 1 : 0
col06 = sent >= 80 and sent <   90 ? 1 : 0
col07 = sent >= 90                 ? 1 : 0

bgcolor01 = bgcolor(col01 > 0 ? #FF0000 : na,transp=0)
bgcolor02 = bgcolor(col02 > 0 ? #FF5400 : na,transp=25)
bgcolor03 = bgcolor(col03 > 0 ? #FFAA00 : na,transp=50)
bgcolor04 = bgcolor(col04 > 0 ? #FFFF00 : na,transp=75)
bgcolor05 = bgcolor(col05 > 0 ? #AAFF00 : na,transp=50)
bgcolor06 = bgcolor(col06 > 0 ? #54FF00 : na,transp=25)
bgcolor07 = bgcolor(col07 > 0 ? #00FF00 : na,transp=0)

//colors
col1 = #FF0000
col2 = #FF5400
col3 = #FFAA00
col4 = #FFFF00
col5 = #AAFF00
col6 = #54FF00
col7 = #00FF00

//color conditions
cc01 = sent                <=  10 ? 1 : 0
cc02 = sent >  10 and sent <=  20 ? 1 : 0
cc03 = sent >  20 and sent <=  30 ? 1 : 0
cc04 = sent >  30 and sent <   70 ? 1 : 0
cc05 = sent >= 70 and sent <   80 ? 1 : 0
cc06 = sent >= 80 and sent <   90 ? 1 : 0
cc07 = sent >= 90                 ? 1 : 0

signal_color = cc01> 0?col1:cc02> 0?col2:cc03> 0?col3:cc04> 0?col4:cc05> 0?col5:cc06> 0?col6:cc07> 0?col7:na
signal = sent <= 30 ? rsi_1+5 : sent >= 70 ? rsi_1-5 : na
plot_signal = plot(signal,color=signal_color,linewidth=3,style=circles )