PROTECTED SOURCE SCRIPT
Güncellendi Dynamic Structure Overlay [AlgoXcalibur]
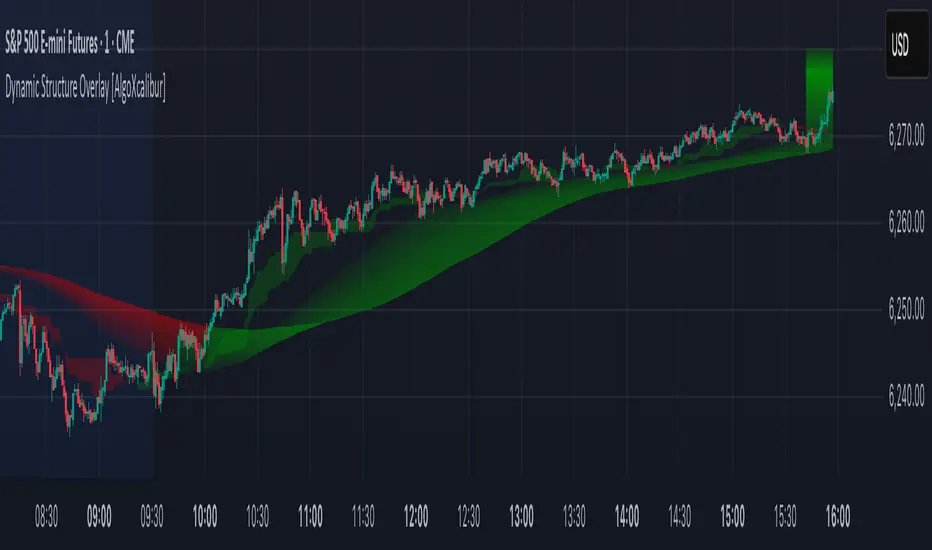
Dynamic Structure Overlay combines an ultra-dynamic Ribbon, adaptive supply/demand Zones, and a versatile momentum-based Cloud to paint a stunning picture of market structure. Whether you're riding strong trends or patiently analyzing consolidation, this tool helps visualize factors that influence trend direction and price movement.
📊 Indicator Components and Functions
This indicator integrates three core elements to provide an intuitive analysis of trend and market structure. Each component can be independently enabled or disabled to suit your preferences.
• Dynamic Ribbon
At the center of attention is the Dynamic Ribbon, which uses multi-layered moving averages rendered as a flowing ribbon with adaptive color gradients. It reacts to price action in real time, revealing trend direction, strength, and periods of expansion or compression.
• Dynamic Zones
These volume-weighted supply and demand zones are derived from price-to-volume deviations relative to VWAP. These zones often guide price action during strong trends.
• Dynamic Cloud
A unique momentum-based structure derived from dynamic price ranges by averaging the highs and lows from recent price action. The Cloud captures momentum strength and directional pressure, providing a visual guide to trend continuations and transitions.
Together, these components form a comprehensive overlay that adapts in real time to changing market conditions.
🚀 Ride the Trend
Dynamic Structure Overlay is a multi-dimensional tool — its framework helps visualize dynamic factors that often influence price action, assisting traders in staying aligned with the evolving trend.
Sürüm Notları
Update: Enhanced color brightness and transparencyKorumalı komut dosyası
Bu komut dosyası kapalı kaynak olarak yayınlanmaktadır. Ancak, ücretsiz ve herhangi bir sınırlama olmaksızın kullanabilirsiniz – daha fazla bilgiyi buradan edinebilirsiniz.
Feragatname
Bilgiler ve yayınlar, TradingView tarafından sağlanan veya onaylanan finansal, yatırım, alım satım veya diğer türden tavsiye veya öneriler anlamına gelmez ve teşkil etmez. Kullanım Koşulları bölümünde daha fazlasını okuyun.
Korumalı komut dosyası
Bu komut dosyası kapalı kaynak olarak yayınlanmaktadır. Ancak, ücretsiz ve herhangi bir sınırlama olmaksızın kullanabilirsiniz – daha fazla bilgiyi buradan edinebilirsiniz.
Feragatname
Bilgiler ve yayınlar, TradingView tarafından sağlanan veya onaylanan finansal, yatırım, alım satım veya diğer türden tavsiye veya öneriler anlamına gelmez ve teşkil etmez. Kullanım Koşulları bölümünde daha fazlasını okuyun.