OPEN-SOURCE SCRIPT
Fibonacci Toolkit [LuxAlgo]
This toolkit aims to display multiple Fibonacci drawing tools including retracements, arcs, circles, fans, timezones and spirals.
Usage
Upon adding the indicator to the chart, users will be prompted to choose a starting point and an ending point for the calculation of the drawing tools.
Users can then navigate to the settings of the toolkit and choose which drawing tool to display using the Fibonacci drop-down menu. Users are also free to change the default Fibonacci ratios used by the indicator from within the settings. Each tool is described below.
Retracements

Fibonacci retracements display multiple levels constructed using the starting price point, ending price point, and multiple Fibonacci ratios. These levels can be used as support and resistance.
Arcs

Fibonacci arcs display multiple semi-circles. Each semi-circle crosses the line connecting the starting & end price point at a certain percentage determined by Fibonacci ratios. These arcs can be used as support and resistance.
Circles

The Fibonacci circles are similar to the Fibonacci arcs but display a full circle instead. Users can expect the price to bounce off of the circles.
This tool is less commonly used by traders.
Fan

A Fibonacci fan is a tool displaying trendlines all connected to a starting point and extending to a point determined by Fibonacci ratios. These can also be used as support and resistance.
Timezone

Fibonacci timezones return a series of horizontal lines. The distance of the lines increases by a factor given by the numbers in the Fibonacci sequence.
This tool can be useful to highlight points where a trend might reverse assuming that their duration increases over time.
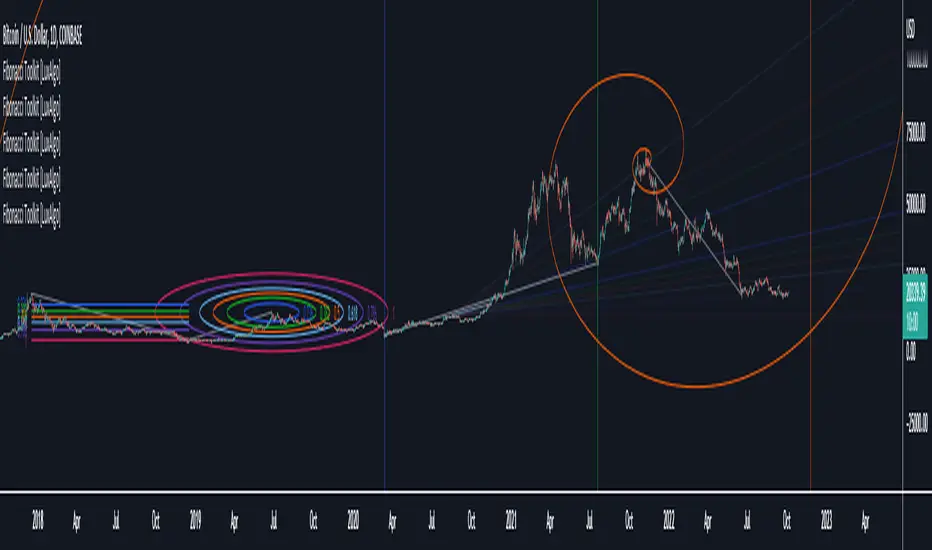
Spiral

The Fibonnaci spiral displays a spiral that grows by a factor given by the golden ratio. This indicator returns a spiral using 7 turns (5 internal) and sets the origin of the spiral to the ending point which is selected by the user. The height of the spiral is based on the price range between the starting point and ending point.
Note that potential display artifacts can be seen when fitting the spiral on stocks and forex pairs.
Usage
Upon adding the indicator to the chart, users will be prompted to choose a starting point and an ending point for the calculation of the drawing tools.
Users can then navigate to the settings of the toolkit and choose which drawing tool to display using the Fibonacci drop-down menu. Users are also free to change the default Fibonacci ratios used by the indicator from within the settings. Each tool is described below.
Retracements
Fibonacci retracements display multiple levels constructed using the starting price point, ending price point, and multiple Fibonacci ratios. These levels can be used as support and resistance.
Arcs
Fibonacci arcs display multiple semi-circles. Each semi-circle crosses the line connecting the starting & end price point at a certain percentage determined by Fibonacci ratios. These arcs can be used as support and resistance.
Circles
The Fibonacci circles are similar to the Fibonacci arcs but display a full circle instead. Users can expect the price to bounce off of the circles.
This tool is less commonly used by traders.
Fan
A Fibonacci fan is a tool displaying trendlines all connected to a starting point and extending to a point determined by Fibonacci ratios. These can also be used as support and resistance.
Timezone
Fibonacci timezones return a series of horizontal lines. The distance of the lines increases by a factor given by the numbers in the Fibonacci sequence.
This tool can be useful to highlight points where a trend might reverse assuming that their duration increases over time.
Spiral
The Fibonnaci spiral displays a spiral that grows by a factor given by the golden ratio. This indicator returns a spiral using 7 turns (5 internal) and sets the origin of the spiral to the ending point which is selected by the user. The height of the spiral is based on the price range between the starting point and ending point.
Note that potential display artifacts can be seen when fitting the spiral on stocks and forex pairs.
Sürüm Notları
Minor changes.Açık kaynak kodlu komut dosyası
Gerçek TradingView ruhuna uygun olarak, bu komut dosyasının oluşturucusu bunu açık kaynaklı hale getirmiştir, böylece yatırımcılar betiğin işlevselliğini inceleyip doğrulayabilir. Yazara saygı! Ücretsiz olarak kullanabilirsiniz, ancak kodu yeniden yayınlamanın Site Kurallarımıza tabi olduğunu unutmayın.
Get access to our exclusive tools: luxalgo.com
Join our 150k+ community: discord.gg/lux
All content provided by LuxAlgo is for informational & educational purposes only. Past performance does not guarantee future results.
Join our 150k+ community: discord.gg/lux
All content provided by LuxAlgo is for informational & educational purposes only. Past performance does not guarantee future results.
Feragatname
Bilgiler ve yayınlar, TradingView tarafından sağlanan veya onaylanan finansal, yatırım, işlem veya diğer türden tavsiye veya tavsiyeler anlamına gelmez ve teşkil etmez. Kullanım Şartları'nda daha fazlasını okuyun.
Açık kaynak kodlu komut dosyası
Gerçek TradingView ruhuna uygun olarak, bu komut dosyasının oluşturucusu bunu açık kaynaklı hale getirmiştir, böylece yatırımcılar betiğin işlevselliğini inceleyip doğrulayabilir. Yazara saygı! Ücretsiz olarak kullanabilirsiniz, ancak kodu yeniden yayınlamanın Site Kurallarımıza tabi olduğunu unutmayın.
Get access to our exclusive tools: luxalgo.com
Join our 150k+ community: discord.gg/lux
All content provided by LuxAlgo is for informational & educational purposes only. Past performance does not guarantee future results.
Join our 150k+ community: discord.gg/lux
All content provided by LuxAlgo is for informational & educational purposes only. Past performance does not guarantee future results.
Feragatname
Bilgiler ve yayınlar, TradingView tarafından sağlanan veya onaylanan finansal, yatırım, işlem veya diğer türden tavsiye veya tavsiyeler anlamına gelmez ve teşkil etmez. Kullanım Şartları'nda daha fazlasını okuyun.