PROTECTED SOURCE SCRIPT
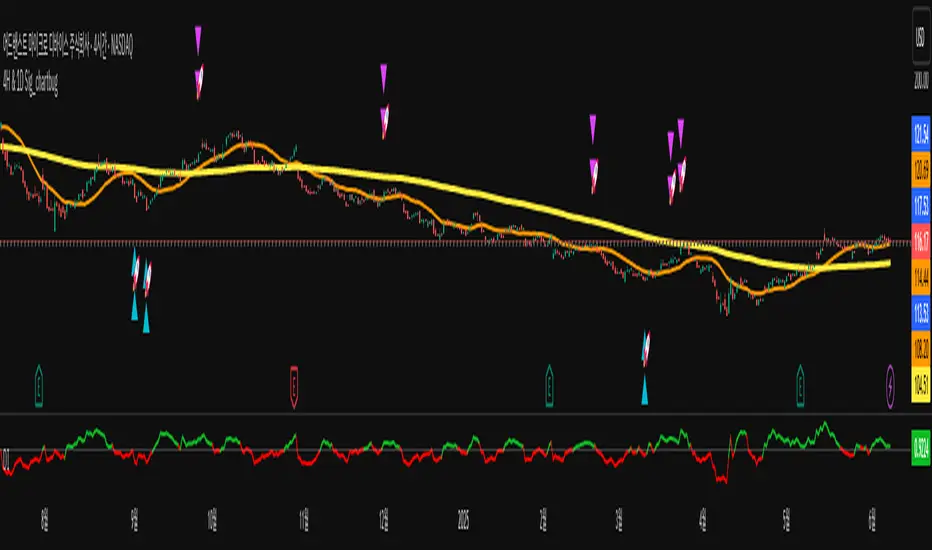
4H & 1D Sig_chartbug
Rohmoohyun is alive
Auxiliary Indicator for Buy/Sell Signals Using Bollinger Bands and Moving Averages.
Recommended for NASDAQ, Gold, Oil, BTC, Stocks on 4-hour or higher timeframes.
For Ethereum, Ripple, and other volatile altcoins, it is advisable to also check the daily chart.
Indicator Idea: This strategy utilizes two types of indicators: Bollinger Bands as a volatility (or momentum) indicator, and Moving Averages as a trend indicator. A triangle signal is generated in zones where the Bollinger Bands converge (squeeze). After a candle closes, a Rocket icon will appear, at which point a trading strategy can be devised based on the prevailing trend indicated by the Moving Averages.
Indicator Feature: When used on timeframes of 4 hours or higher, this indicator is extremely powerful for establishing trading criteria, especially when combined with trend analysis and support/resistance zones.
Basic Trading Method: Enter a position at the Rocket icon + Immediately set a stop-loss (e.g., at the previous low/high, a maximum loss threshold like 2% of capital, or at a level planned for a second entry to average down) + Take partial profit (e.g., 50%) at your desired TP level, then move the stop-loss to your entry price (break-even) and hold the remainder of the position.
Recommended Timeframes: 5-minute, 4-hour, 1-day.
Trading Strategy
Pullback Trading / Trend Reversal Trading.
Instrument Selection (Commodities & Indices, Crypto, NASDAQ-listed Stocks).
Understand Instrument Characteristics (The three categories behave differently, so backtesting before use is essential).
a) Bullish Alignment (Price > 20MA > 200MA)
: Focus primarily on long (buy) positions.
: If attempting a counter-trend (short) trade, do so only with multiple confirmations, such as RSI/Disparity divergence and a major resistance zone. Use a tight stop-loss.
b) Bearish Alignment (Price < 20MA < 200MA)
: The opposite of the above; focus on short (sell) positions.
c) During a Bullish Trend, Price is Between MAs (200MA < Price < 20MA)
: This indicates either a consolidation phase within an uptrend or a potential early sign of a reversal to a downtrend. Consider both possibilities.
: A possible approach is to allocate capital with a 60% bias to long positions and a 40% bias to short positions (unlike in full bullish/bearish alignments where counter-trend trading has a poor risk/reward ratio).
: If it turns out to be a reversal point, you can enter a position at the very beginning of a new trend, allowing for a longer ride.
: It's recommended to take partial profits rather than closing the entire position. For instance, close half and move the stop-loss to your entry price to eliminate risk while keeping profit potential open.
d) During a Bearish Trend, Price is Between MAs (200MA > Price > 20MA)
: The opposite of the above.
Instrument-Specific Characteristics
Commodities & Indices (NASDAQ, Oil, Gold)
: The indicator was primarily developed and tested on NASDAQ and Gold, so it tends to work well with them.
: However, NASDAQ often exhibits strong, one-way trends, so a trend-following approach is highly recommended.
: Gold and Oil tend to have significant reversals from key support/resistance zones.
Crypto
: These assets are extremely volatile, so use this indicator with caution and skill.
: It performs reasonably well with BTC. For anything from Ethereum downwards, the price action can be chaotic, so it's crucial to use the daily chart and other confirming factors.
: Instead of frequent day trading, focus on long-term positions, reduce the number of trades, and aim for entries with a good average price.
NASDAQ-listed Stocks
: Recommended for a long-term, accumulation-style investment approach.
: Use the indicator not as a signal that "it will pump immediately!" but rather as a sign that "this is a decent entry point to build a position."
: Alternatively, it can be used for more active swing trading (buy, sell, repeat).
Important Disclaimers
This is an auxiliary indicator, as the name implies. Do not trust it blindly.
When entering a position, immediately set your stop-loss or have a plan for a single additional entry (max one recommended).
Always use it in conjunction with other forms of analysis.
Track your performance (win rate, risk/reward ratio) based on this strategy.
Continuously refine and improve your approach.
Korumalı komut dosyası
Bu komut dosyası kapalı kaynak olarak yayınlanmaktadır. Ancak, ücretsiz ve herhangi bir sınırlama olmaksızın kullanabilirsiniz – daha fazla bilgiyi buradan edinebilirsiniz.
Feragatname
Bilgiler ve yayınlar, TradingView tarafından sağlanan veya onaylanan finansal, yatırım, alım satım veya diğer türden tavsiye veya öneriler anlamına gelmez ve teşkil etmez. Kullanım Koşulları bölümünde daha fazlasını okuyun.