OPEN-SOURCE SCRIPT
Güncellendi Awesome Cumulative Volume Oscillator

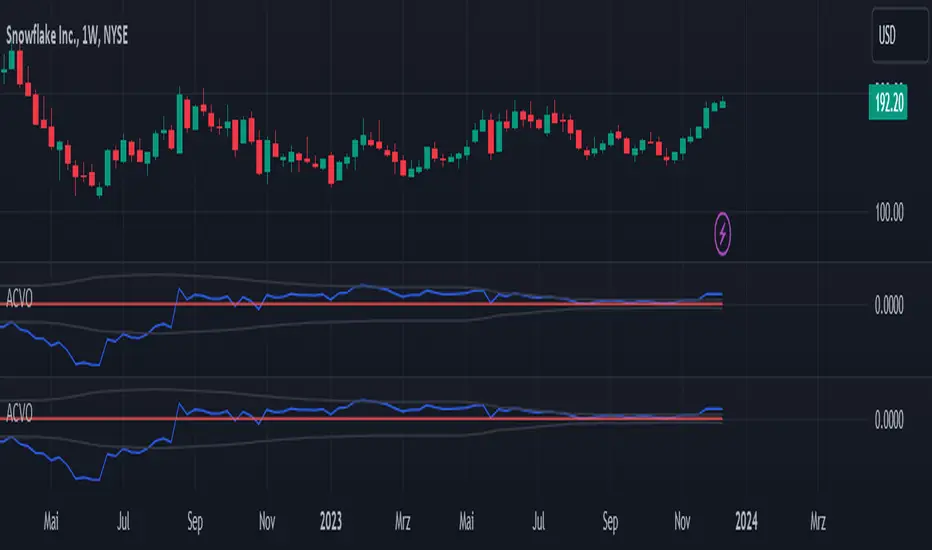
The indicator is called the "Awesome Cumulative Volume Oscillator" (ACVO), which analyzes the cumulative trading volume of the underlying asset.
The indicator also plots the deviation of the cumulative trading volume from the first SMA value, which is referred to as the "Cumulative Volume Deviation". The zero-line is plotted as a reference point.
If the "Cumulative Volume Deviation" is greater than 0, it indicates an uptrend, as the cumulative trading volume is above the first SMA value. If the "Cumulative Volume Deviation" is less than 0, it indicates a downtrend, as the cumulative trading volume is below the first SMA value.
However, it is important to note that using a single indicator is not sufficient to conduct a comprehensive market analysis. It is necessary to combine multiple indicators and analysis methods to make informed trading decisions.
Sürüm Notları
The indicator is called the "Awesome Cumulative Volume Oscillator" (ACVO), which analyzes the cumulative trading volume of the underlying asset.The indicator also plots the deviation of the cumulative trading volume from the first SMA value, which is referred to as the "Cumulative Volume Deviation". The zero-line is plotted as a reference point.
If the "Cumulative Volume Deviation" is greater than 0, it indicates an uptrend, as the cumulative trading volume is above the first SMA value. If the "Cumulative Volume Deviation" is less than 0, it indicates a downtrend, as the cumulative trading volume is below the first SMA value.
However, it is important to note that using a single indicator is not sufficient to conduct a comprehensive market analysis. It is necessary to combine multiple indicators and analysis methods to make informed trading decisions.
Açık kaynak kodlu komut dosyası
Gerçek TradingView ruhuyla, bu komut dosyasının mimarı, yatırımcıların işlevselliğini inceleyip doğrulayabilmesi için onu açık kaynaklı hale getirdi. Yazarı tebrik ederiz! Ücretsiz olarak kullanabilseniz de, kodu yeniden yayınlamanın Topluluk Kurallarımıza tabi olduğunu unutmayın.
Feragatname
Bilgiler ve yayınlar, TradingView tarafından sağlanan veya onaylanan finansal, yatırım, alım satım veya diğer türden tavsiye veya öneriler anlamına gelmez ve teşkil etmez. Kullanım Koşulları bölümünde daha fazlasını okuyun.