Wahrscheinlichkeits-Oszillator
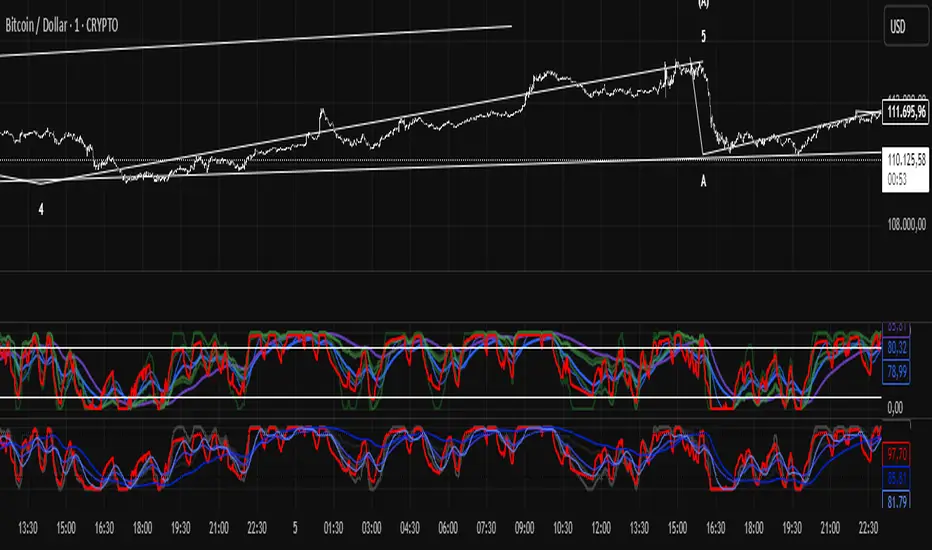
The indicator measures, over several different time windows (eight different historyLength values), the probability that the current indicator value (here, a 14-period SMA of the closing price) is higher than past values in that window.
These probabilities (named prob1 … prob8) are expressed as percentages (0–100). The arithmetic mean of these eight percentages is avgLine. Additionally, there are smoothings (SMMA) and a baseline (SMA of avgLine), similar to Bollinger Bands.
Step-by-Step: How the Values Are Calculated
Source:
sma_val = ta.sma(close, 14) → This is the 14-period simple moving average of the closing price. This smoothed price is used as the "current comparison value" (instead of raw close) to reduce noise.
Historical Array & Counting (Function calculateProbability)
For each probX, the function maintains an array of the most recently stored current values (up to historicalLength entries).
For the current sma_val, it counts how many entries in the historical array are smaller than current.
Then this number is divided by the total number of historical entries → result is a decimal between 0 and 1.
Multiplying by 100 gives probX in percent.
Mathematical (Pseudo):
ini
Kopieren
Bearbeiten
prob = (1 / total) * sum_{i=0}^{total-1} [ current > historical ] * 100
→ This is equivalent to the empirical percentile/rank position of the current value within the history.
Eight Windows / Ensemble:
prob1 … prob8 are calculated with different historyLength values (400, 350, 175, 130, 83, 42, 21, 15).
Longer windows measure “long-term” trend strength; shorter windows measure short-term relative strength/momentum.
avgLine:
ini
Kopieren
Bearbeiten
avgLine = (prob1 + ... + prob8) / 8
→ Ensemble average of all eight percentiles. Useful for smoothing extreme values from individual windows.
Smoothing (SMMA):
SMMA on prob1 and SMMA1 on avgLine reduce short-term fluctuations and make signals more stable.
Baseline & “Bands”:
Finally, basis = ta.sma(avgLine, length) and dev = mult * ta.stdev(avgLine, length) are calculated — this is exactly the baseline + band logic of a Bollinger-style representation, applied to avgLine.
Why It’s Meaningful
Percentiles/ranks are robust to scale changes. Instead of absolute price differences, the indicator answers: “Is the current (smoothed) price higher than usual over the last N periods?”
The ensemble of multiple window lengths captures different market regimes: short windows react quickly to momentum, long windows provide context and reduce false signals.
Smoothing (SMA/SMMA) reduces noise, making signals less sensitive to intraday jitter.
Interpretation: When Is the Market “Overheated” / “Not Overheated”?
High values (e.g., avgLine ≈ 80–100 or individual probX > 90):
The current SMA is higher than almost all previous values in the considered window → strong bullish dominance. This can indicate a strong rally (momentum), but also potential overbought conditions, especially if:
Volume growth is slowing, or
avgLine has remained very high for several periods (overextension).
Low values (e.g., avgLine ≈ 0–20):
The current SMA is below most of the historical values → market is under pressure or potentially oversold. Short-term reversal/recovery opportunities are more likely, especially if multiple windows are simultaneously low.
Values around ~50: Neutral — the current value is typical, in the middle of its historical distribution.
Concrete Rule (Your Specification): Buy / Sell
Buy Signal: When all eight lines (prob1 … prob8) are below lowerLine (e.g., lowerLine = 20).
→ Meaning: In all short- to long-term windows, the current SMA is below most historical values → strong, broadly confirmed undervaluation signal (potential rebound or end of correction).
Recommendation: Strong convergent long signal, especially if accompanied by volume increase or support confirmation.
Sell Signal: When all eight lines are above upperLine (e.g., upperLine = 90).
→ Meaning: In all windows, the current SMA is higher than almost all historical values → broadly confirmed overbought / overheating.
Recommendation: Strong convergent short/take-profit signal, especially if coinciding with divergences, weakening volume, or resistance areas.
Important Limitations & Risks (Pay Attention!)
Trend vs. Mean-Reversion: In a strong trend, all windows can stay high for a long time (trend continuation risk). An “all below lower → buy” signal can continue to fall in a strong downtrend → use stop-loss and trend filter (higher TF).
Historical Length & Sampling: Chosen historyLength values determine sensitivity. Very long windows make the indicator slower; very short windows increase noise.
Statistical Stationarity: Percentile signals assume the distribution remains comparable — in crashes/news events, distributions can break.
Smoothing / Lag: SMMA reduces false breakouts but adds delay — trade entries may occur later.
Practical Examples (Concrete)
Example Buy: prob1..prob8 = [12, 15, 8, 10, 14, 11, 9, 13], lowerLine = 20 → all below 20 → strong long signal.
Example Sell: prob1..prob8 = [92, 95, 90, 94, 91, 96, 93, 97], upperLine = 90 → all above 90 → take-profit / short signal.
Conclusion (Short)
Your indicator is a percentile/ranking oscillator over multiple windows — a robust ensemble measuring the relative position of the (smoothed) price to its own history.
Overheated = high, broadly confirmed prob values (e.g., all > upperLine).
Oversold = low, broadly confirmed prob values (e.g., all < lowerLine) → your rule: all below lowerLine = buy, all above upperLine = sell.
Never trade blindly — always use risk management and confirmation (volume, higher timeframes, structure).
Yalnızca davetli komut dosyası
Bu komut dosyasına yalnızca yazar tarafından onaylanan kullanıcılar erişebilir. Kullanmak için izin istemeniz ve almanız gerekir. Bu genellikle ödeme yapıldıktan sonra verilir. Daha fazla ayrıntı için aşağıdaki yazarın talimatlarını izleyin veya doğrudan kultr ile iletişime geçin.
TradingView, yazarına tamamen güvenmediğiniz ve nasıl çalıştığını anlamadığınız sürece bir komut dosyası için ödeme yapmanızı veya kullanmanızı TAVSİYE ETMEZ. Ayrıca topluluk komut dosyalarımızda ücretsiz, açık kaynaklı alternatifler bulabilirsiniz.
Yazarın talimatları
Feragatname
Yalnızca davetli komut dosyası
Bu komut dosyasına yalnızca yazar tarafından onaylanan kullanıcılar erişebilir. Kullanmak için izin istemeniz ve almanız gerekir. Bu genellikle ödeme yapıldıktan sonra verilir. Daha fazla ayrıntı için aşağıdaki yazarın talimatlarını izleyin veya doğrudan kultr ile iletişime geçin.
TradingView, yazarına tamamen güvenmediğiniz ve nasıl çalıştığını anlamadığınız sürece bir komut dosyası için ödeme yapmanızı veya kullanmanızı TAVSİYE ETMEZ. Ayrıca topluluk komut dosyalarımızda ücretsiz, açık kaynaklı alternatifler bulabilirsiniz.