PROTECTED SOURCE SCRIPT
The Oracle by Jaehee
The Oracle
Summary
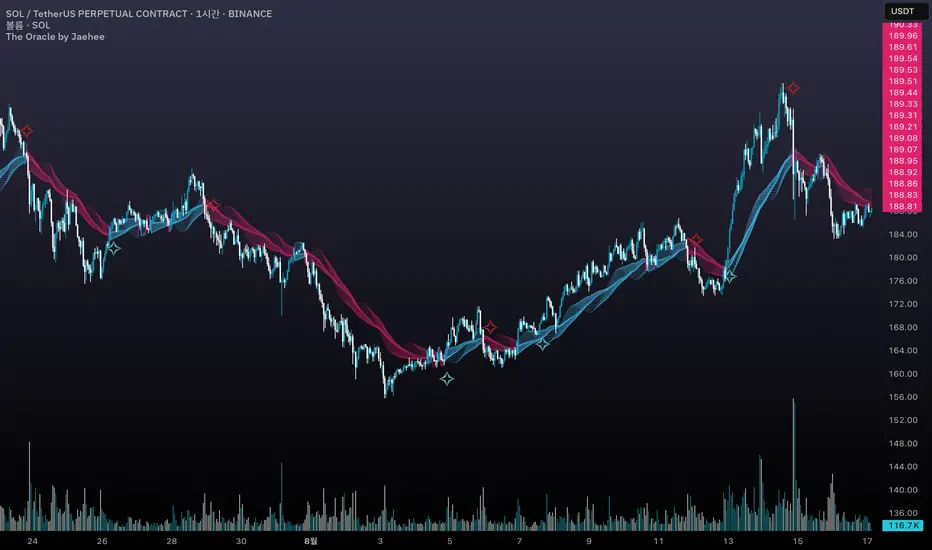
The Oracle is a volatility-adaptive trend indicator built on a smoothed range filter, persistence counters, and regime-flip logic. Signals appear only when price establishes a sustained move and flips from one regime to the other. An EMA(50)-anchored ribbon provides a flowing visual context but does not drive signals.
What it does
① Calculates a smoothed volatility-based range to adapt to market conditions
② Builds a filtered price path that reduces single-bar noise
③ Tracks persistence of upward or downward filter movement with counters
④ Confirms Buy/Sell signals only on regime flips, not on single ticks
⑤ Draws a multi-phase ribbon around EMA(50) to visualize slope and bias
How it works (concept level)
① Smoothed Range: Double EMA of absolute price change, scaled by multiplier
② Filtered Price: Range filter constrains price movement to reduce noise
③ Persistence Counters: Upward/Downward counters accumulate only if the filter continues in one direction
④ Signal Logic:
• Buy = price above filter AND prior regime was short
• Sell = price below filter AND prior regime was long
• Requires a full flip of state to confirm new signals
⑤ Ribbon: EMA(50) baseline with sinusoidal offsets creates a flowing ribbon, colored by EMA slope (visual only)
Why it is useful
① Noise resistance: Avoids whipsaws by requiring persistence + state flips
② Clarity: Ribbon visually encodes background trend for quick recognition
③ Balanced design: Combines volatility adaptation, persistence, and confirmation in one framework
④ Adaptable: Works across assets and timeframes without heavy parameter tuning
How to use it
① Signal reading:
• ✧ Buy marker = confirmed transition into an upward regime
• ✧ Sell marker = confirmed transition into a downward regime
• Use bar close confirmation
② Ribbon context: Align trades with ribbon slope/color to stay with the dominant trend
③ Timeframes:
• Higher (4H, Daily) = better swing bias
• Lower (5m, 15m) = faster signals but noisier
④ Combination: Pair with ATR stops, position sizing, or volume/momentum studies for added confirmation
Limitations
① Still possible to see false flips in choppy consolidations
② Smoothing introduces slight delay in regime confirmation
③ Signals can repaint intrabar — confirm on bar close
④ Indicator only — no built-in money management or strategy logic
Best Practices (Recommended Use)
① Confirm on bar close
• Signals can change intrabar; always make decisions after the bar has closed.
② Validate across multiple timeframes
• Although the tool adapts to volatility, reliability improves on higher timeframes.
• In practice, the 1-hour chart has shown the most stable balance between reactivity and noise.
③ Align with ribbon bias
• Trade in the same direction as the ribbon slope/color to reduce countertrend exposure.
④ Combine with independent risk management
• Use stop-losses, position sizing, or ATR-based targets outside the script.
• The indicator highlights transitions, but risk control must be user-defined.
⑤ Use as confirmation, not prediction
• Treat signals as confirmation of regime change, not as a forecast of future price.
Summary
The Oracle is a volatility-adaptive trend indicator built on a smoothed range filter, persistence counters, and regime-flip logic. Signals appear only when price establishes a sustained move and flips from one regime to the other. An EMA(50)-anchored ribbon provides a flowing visual context but does not drive signals.
What it does
① Calculates a smoothed volatility-based range to adapt to market conditions
② Builds a filtered price path that reduces single-bar noise
③ Tracks persistence of upward or downward filter movement with counters
④ Confirms Buy/Sell signals only on regime flips, not on single ticks
⑤ Draws a multi-phase ribbon around EMA(50) to visualize slope and bias
How it works (concept level)
① Smoothed Range: Double EMA of absolute price change, scaled by multiplier
② Filtered Price: Range filter constrains price movement to reduce noise
③ Persistence Counters: Upward/Downward counters accumulate only if the filter continues in one direction
④ Signal Logic:
• Buy = price above filter AND prior regime was short
• Sell = price below filter AND prior regime was long
• Requires a full flip of state to confirm new signals
⑤ Ribbon: EMA(50) baseline with sinusoidal offsets creates a flowing ribbon, colored by EMA slope (visual only)
Why it is useful
① Noise resistance: Avoids whipsaws by requiring persistence + state flips
② Clarity: Ribbon visually encodes background trend for quick recognition
③ Balanced design: Combines volatility adaptation, persistence, and confirmation in one framework
④ Adaptable: Works across assets and timeframes without heavy parameter tuning
How to use it
① Signal reading:
• ✧ Buy marker = confirmed transition into an upward regime
• ✧ Sell marker = confirmed transition into a downward regime
• Use bar close confirmation
② Ribbon context: Align trades with ribbon slope/color to stay with the dominant trend
③ Timeframes:
• Higher (4H, Daily) = better swing bias
• Lower (5m, 15m) = faster signals but noisier
④ Combination: Pair with ATR stops, position sizing, or volume/momentum studies for added confirmation
Limitations
① Still possible to see false flips in choppy consolidations
② Smoothing introduces slight delay in regime confirmation
③ Signals can repaint intrabar — confirm on bar close
④ Indicator only — no built-in money management or strategy logic
Best Practices (Recommended Use)
① Confirm on bar close
• Signals can change intrabar; always make decisions after the bar has closed.
② Validate across multiple timeframes
• Although the tool adapts to volatility, reliability improves on higher timeframes.
• In practice, the 1-hour chart has shown the most stable balance between reactivity and noise.
③ Align with ribbon bias
• Trade in the same direction as the ribbon slope/color to reduce countertrend exposure.
④ Combine with independent risk management
• Use stop-losses, position sizing, or ATR-based targets outside the script.
• The indicator highlights transitions, but risk control must be user-defined.
⑤ Use as confirmation, not prediction
• Treat signals as confirmation of regime change, not as a forecast of future price.
Korumalı komut dosyası
Bu komut dosyası kapalı kaynak olarak yayınlanmaktadır. Ancak, ücretsiz ve herhangi bir sınırlama olmaksızın kullanabilirsiniz – daha fazla bilgiyi buradan edinebilirsiniz.
Feragatname
Bilgiler ve yayınlar, TradingView tarafından sağlanan veya onaylanan finansal, yatırım, alım satım veya diğer türden tavsiye veya öneriler anlamına gelmez ve teşkil etmez. Kullanım Koşulları bölümünde daha fazlasını okuyun.