OPEN-SOURCE SCRIPT
Güncellendi RSI Dot Party - All Lengths From 1 To 120

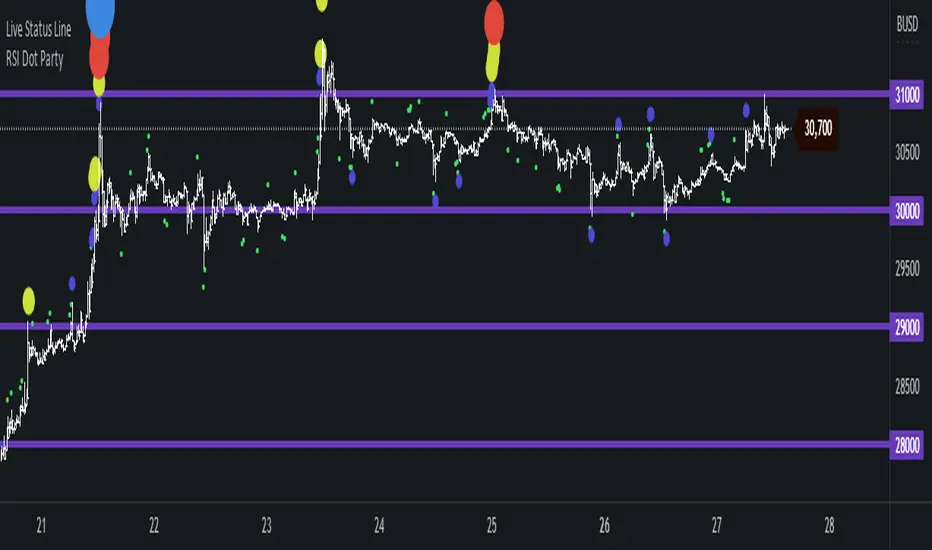
The RSI Dot Party indicator displays all RSI lengths from 1 to 120 as different colored dots on the chart.
🔶 Purpose
🔶 USAGE
🔶 SETTINGS
🔹 Source
🔹 Meta Settings
🔹 7 RSI Groups
🔹 RSI Group Settings
🔹 Show
🔶 ALERTS
🔶 Warning
🔶 Community
I hope you guys find this useful, if you have any questions or feature requests leave me a comment! Take care :D
🔶 Purpose
- Show the reversal point of price action to time entries and exits.
🔶 USAGE
- When a dot displays it is a indication of the reversal of the price/trend. The larger the dot the more likely it is to reverse.
- The Default settings generates dots for extreme cases where the RSI is over = 90 or under = 10 for every RSI length in the range of 1-120.
- Example if the RSI of length 1 or 2 or 3 or 4 or ... or 15 or 16 or 17 or ... or 80 or 81 or 82 or ... if any of does RSI crosses a boundary a dot is shown.
- A boundary is the over/under the RSI oscillates in.
- Customize the settings until the dots match up with the high and lows of past price action.
🔶 SETTINGS
🔹 Source
- Source 1: Is the First Source RSI is calculated from
- Source 2: Is the Second Source RSI is calculated from
🔹 Meta Settings
- Hours back to draw: To speed up the script calculate it only draws a set number of hours back, default is 300 hours back in time to draw then it cuts off.
- Show Dots: Show or disable dots
- Show Bar Color: Color the bars for each RSI incident
- Filter Cross: Filters and only shows dots when the RSI crosses above or bellow a boundary. If not all candles above or bellow the boundaries will display a dot.
- Dots Location Absolute: Instead of showing the dots above or bellow the candle, the dots will show up on the top and bottom of the window.
🔹 7 RSI Groups
- There are a total of 7 RSI colors.
- Range Very Tiny: Default Color Green
- Range Tiny: Default Color Purple
- Range Small: Default Color Yellow
- Range Normal: Default Color Red
- Range Large: Default Color Blue
- Range Huge: Default Color Dark Purple
- Range Very Huge: Default Color White
🔹 RSI Group Settings
- Hi/Low Color: Change the Color of that group.
- Start/End: The Start and End range of this RSI color. Example if start = 5 and end = 10 the RSI of 5,6,7,8,9,10 will be displayed on the chart for that color, if any of does RSI goes above or bellow the boundary a dot is displayed on that candle.
- Delay: The RSI needs to be above or bellow a boundary for x number of candles before displaying a dot. For example if delay = 2 and the RSI is over = 70 for 2 candles then it will display a dot.
- Under/Over: Boundaries that indicate when to draw a dot, if over = 70 and RSI crosses above 70 a dot is displayed.
🔹 Show
- Section that allows you to disable RSI grounds you dont want to see, this also removes them from the alert signal generated.
- Show Low: Show or disable Low RSI dots
- Show High: Show or disable High RSI dots
🔶 ALERTS
- Alert for all New RSIs Dots Created in real time
- The alert generated depends on what groups are showing or not, if the green group is disabled for example the alert will not be generated.
🔶 Warning
- When a dot shows up it can continue moving. For example if a purple dot shows itself above a 15 minute candle, if that candle/price continue to extend up the dot will move up with it.
- Dots can also disappear occasionally if the RSI moves in and out of a boundary within that candles life span.
🔶 Community
I hope you guys find this useful, if you have any questions or feature requests leave me a comment! Take care :D
Sürüm Notları
- Updated Settings making it more intuitive
Sürüm Notları
- Fixed redraw but historical data will no longer match up in real time, if dot cross above and bellow a boundary during that candles life span the dot will no longer disappear.
Sürüm Notları
Speed up: Removed Second SourceAdded Realtime, Confirmed or Default behavior option in settings
Açık kaynak kodlu komut dosyası
Gerçek TradingView ruhuyla, bu komut dosyasının mimarı, yatırımcıların işlevselliğini inceleyip doğrulayabilmesi için onu açık kaynaklı hale getirdi. Yazarı tebrik ederiz! Ücretsiz olarak kullanabilseniz de, kodu yeniden yayınlamanın Topluluk Kurallarımıza tabi olduğunu unutmayın.
Feragatname
Bilgiler ve yayınlar, TradingView tarafından sağlanan veya onaylanan finansal, yatırım, alım satım veya diğer türden tavsiye veya öneriler anlamına gelmez ve teşkil etmez. Kullanım Koşulları bölümünde daha fazlasını okuyun.