OPEN-SOURCE SCRIPT
Güncellendi Detrended Price Oscillator with projected SMA
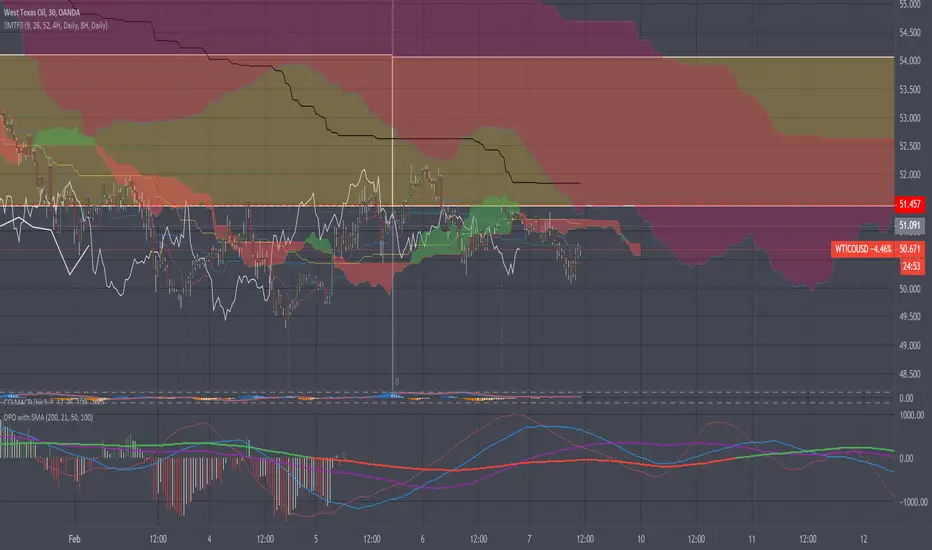
Haven't seen any DPO scripts like this one...
Dpo is generaly use to find cycles in the market rather than prices trends.
As you can see a centralized Dpo is ploted with barsback *actual is shown behing actual price timeline.
Using timeline diferences between the two last highest or the two last lowest histogram bands can give you an aproximation of those market cycles.
Dpo SMA's trends can also be use to compare actual price timeline direction in 3 ways...
#-1: Is the actual price (candles) trend is against or with the dpo SMA's (convergence;divergence) ?
#-2: Is the actual price trend is condensed or dispersed ( criticals values)?
#-3: Does the dpo SMA's are near or far from the dpo cycle bottoms or cycle tops ?
Make sure to know that this indicator isn't a trading reccomandation and may not be suited for your trading style as well that it can be badly interpreted. USE WITH CAUTIONS !
//----Coder----//
R.V.
//----Thanx----//
Sürüm Notları
AutoSMA above or below 0 color changeAçık kaynak kodlu komut dosyası
Gerçek TradingView ruhuyla, bu komut dosyasının mimarı, yatırımcıların işlevselliğini inceleyip doğrulayabilmesi için onu açık kaynaklı hale getirdi. Yazarı tebrik ederiz! Ücretsiz olarak kullanabilseniz de, kodu yeniden yayınlamanın Topluluk Kurallarımıza tabi olduğunu unutmayın.
Feragatname
Bilgiler ve yayınlar, TradingView tarafından sağlanan veya onaylanan finansal, yatırım, alım satım veya diğer türden tavsiye veya öneriler anlamına gelmez ve teşkil etmez. Kullanım Koşulları bölümünde daha fazlasını okuyun.
Açık kaynak kodlu komut dosyası
Gerçek TradingView ruhuyla, bu komut dosyasının mimarı, yatırımcıların işlevselliğini inceleyip doğrulayabilmesi için onu açık kaynaklı hale getirdi. Yazarı tebrik ederiz! Ücretsiz olarak kullanabilseniz de, kodu yeniden yayınlamanın Topluluk Kurallarımıza tabi olduğunu unutmayın.
Feragatname
Bilgiler ve yayınlar, TradingView tarafından sağlanan veya onaylanan finansal, yatırım, alım satım veya diğer türden tavsiye veya öneriler anlamına gelmez ve teşkil etmez. Kullanım Koşulları bölümünde daha fazlasını okuyun.