PROTECTED SOURCE SCRIPT
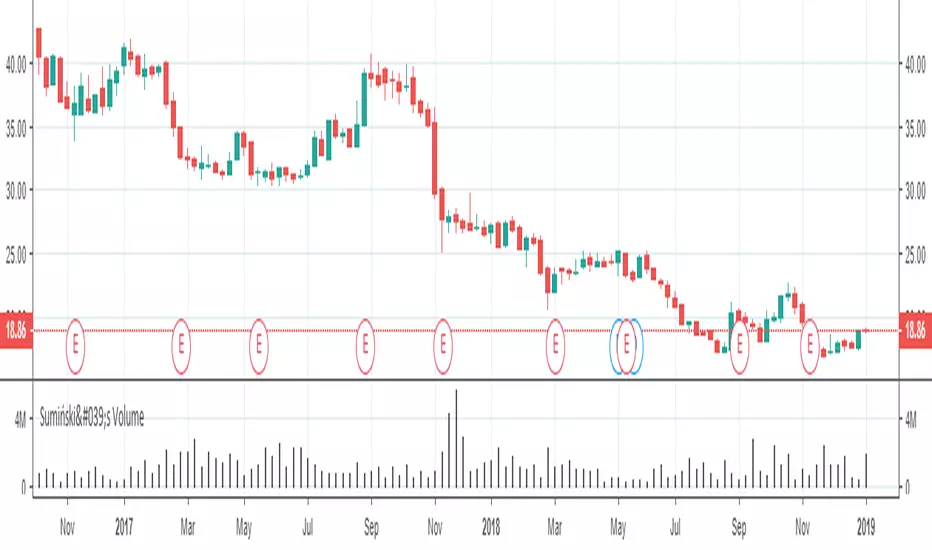
Sumiński's Volume

Hello, this indicator shows us the trading activity in the selected time period. It's similar to the tick volume, the difference being that this indicator is based on real volume. It measures the average amount of volume per 1 pips price in the selected time period. It is useful when after the end of the trend the price comes into consolidation, if at the levels close to support or resistance the indicator shows a high value - it means that there is an intense exchange of contracts or shares - which means that this price level is considered by the market as important.
Sorry for my English and good luck in the markets.
Sorry for my English and good luck in the markets.
Korumalı komut dosyası
Bu komut dosyası kapalı kaynak olarak yayınlanmaktadır. Ancak, özgürce ve herhangi bir sınırlama olmaksızın kullanabilirsiniz – daha fazla bilgi burada.
Feragatname
Bilgiler ve yayınlar, TradingView tarafından sağlanan veya onaylanan finansal, yatırım, işlem veya diğer türden tavsiye veya tavsiyeler anlamına gelmez ve teşkil etmez. Kullanım Şartları'nda daha fazlasını okuyun.