OPEN-SOURCE SCRIPT
Güncellendi Average Daily Range Tracker

Average Daily Range Tracker
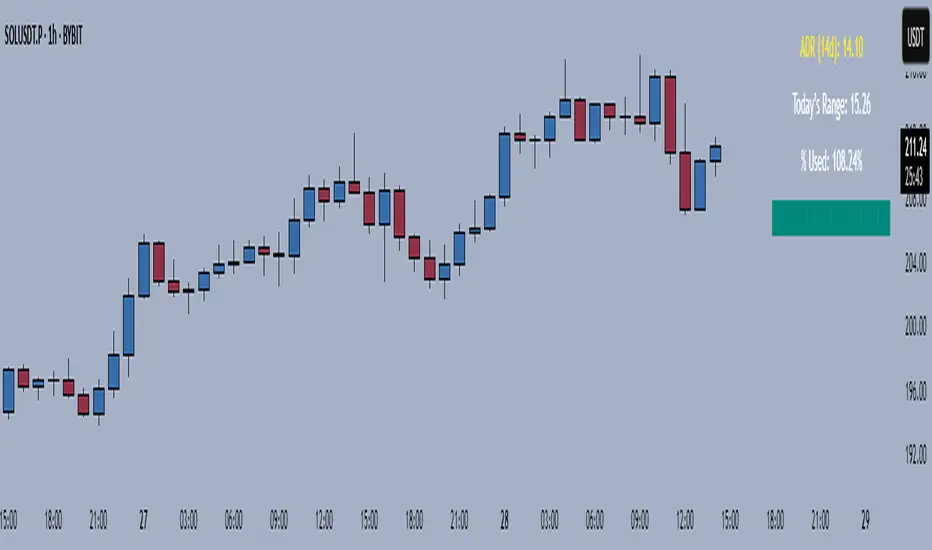
This indicator helps you measure volatility in real time by tracking the Average Daily Range (ADR) and comparing it to the current day’s price action.
🔑 Features
Calculates the ADR over a user-defined lookback period (default = 14 days).
Displays today’s developing range (High–Low) as the session unfolds.
Shows what % of the ADR has already been consumed intraday.
Visual progress bar makes it easy to see how close today is to its historical average range.
Optional ADR plot available in a separate pane.
📈 How traders use it
Spot when a market has already made its “typical” daily move.
Adjust intraday trade expectations: avoid chasing after the bulk of the move is done.
Use % of ADR consumed as a volatility filter for setups.
Combine with support/resistance to identify exhaustion zones.
⚙️ Customization
Lookback length for ADR calculation.
Progress bar size and color.
Optional toggle to plot ADR in its own panel.
Sürüm Notları
Average Daily Range TrackerThis script calculates and tracks the true Average Daily Range (ADR) of the last N daily candles — regardless of what timeframe you’re currently viewing. Unlike many ADR tools that recalc when you switch charts, this version is locked to daily data only, ensuring consistent results.
Features:
✅ ADR based on the last X daily candles (default = 14).
✅ Displays today’s developing daily range in real-time.
✅ Progress bar shows how much of the ADR has been used.
✅ Optional ADR plot (on a separate scale).
✅ Clean table overlay in the top-right corner.
Use case:
Quickly see the average daily volatility of your ticker and how today’s move stacks up against it. Helps with setting realistic targets, stops, and gauging when a move may be stretched.
Açık kaynak kodlu komut dosyası
Gerçek TradingView ruhuyla, bu komut dosyasının mimarı, yatırımcıların işlevselliğini inceleyip doğrulayabilmesi için onu açık kaynaklı hale getirdi. Yazarı tebrik ederiz! Ücretsiz olarak kullanabilseniz de, kodu yeniden yayınlamanın Topluluk Kurallarımıza tabi olduğunu unutmayın.
Feragatname
Bilgiler ve yayınlar, TradingView tarafından sağlanan veya onaylanan finansal, yatırım, alım satım veya diğer türden tavsiye veya öneriler anlamına gelmez ve teşkil etmez. Kullanım Koşulları bölümünde daha fazlasını okuyun.