PROTECTED SOURCE SCRIPT
Güncellendi Range Filter Oscillator - MACD Style [DW]
Educational
----------------------------------------------------------------------------
The **Range Filter Oscillator - MACD Style [DW]** is a technical indicator that helps traders identify trends and potential buy or sell signals. It works by smoothing price movements to filter out noise and focuses on significant price changes.
Here's how it works in simple terms:
1. **Range Filter**: It calculates a dynamic range around the price, based on user settings (like ATR, price percentage, or ticks). Prices moving outside this range are considered significant.
2. **Oscillator**: It measures how far the current price is from the filtered price, creating a value that swings above or below zero, like an oscillator.
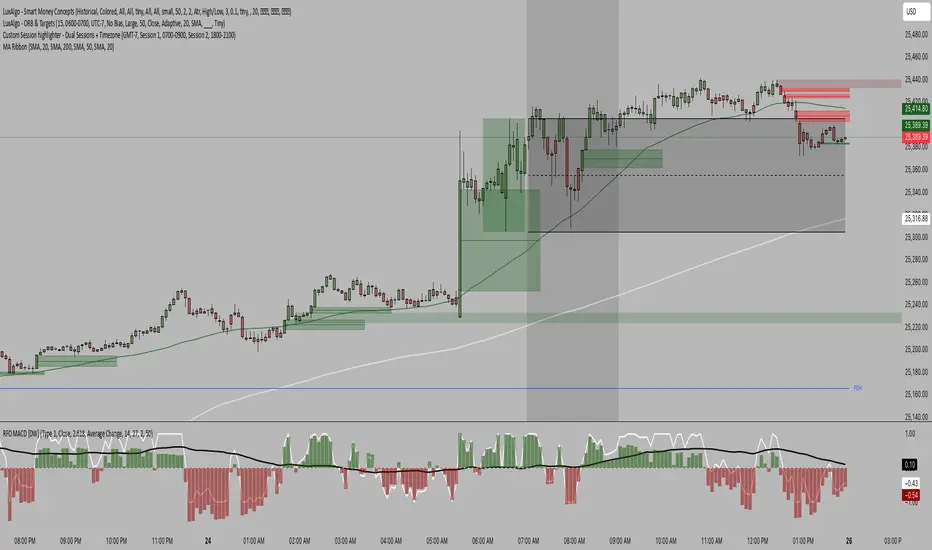
3. **MACD-Style**: It compares the oscillator (fast line) to its smoothed version (slow line, using a simple moving average). The difference between them forms a **histogram**, which shows momentum:
- **Positive histogram** (green): Upward momentum, suggesting a buy signal.
- **Negative histogram** (red): Downward momentum, suggesting a sell signal.
4. **Crossovers**: When the fast line crosses above the slow line, it indicates a potential buy. When it crosses below, it suggests a sell.
5. **Bar Colors**: The chart bars turn green for bullish signals, red for bearish, and gray for neutral, making it easy to spot trend changes.
This indicator is great for spotting trends while ignoring minor price fluctuations, and its MACD-style visuals make it intuitive for traders familiar with momentum indicators.
Sürüm Notları
Educational FIRST I want to give full credit to DonovanWall on tradingview. I simply used Grok to make a MACD version, which in my opinion makes it 2 or 3x as powerful! Although I'm not generally a fan of MACD, his indicator is hugely complimented by it. It's better than the normal MACD.
The Range Filter Oscillator - MACD Style is a technical indicator that helps traders identify trends and potential buy or sell signals. It works by smoothing price movements to filter out noise and focuses on significant price changes.
Here's how it works in simple terms:
Range Filter: It calculates a dynamic range around the price, based on user settings (like ATR, price percentage, or ticks). Prices moving outside this range are considered significant.
Oscillator: It measures how far the current price is from the filtered price, creating a value that swings above or below zero, like an oscillator.
MACD-Style: It compares the oscillator (fast line) to its smoothed version (slow line, using a simple moving average). The difference between them forms a histogram, which shows momentum:
Positive histogram (green): Upward momentum, suggesting a buy signal.
Negative histogram (red): Downward momentum, suggesting a sell signal.
Crossovers: When the fast line crosses above the slow line, it indicates a potential buy. When it crosses below, it suggests a sell.
Bar Colors: The chart bars turn green for bullish signals, red for bearish, and gray for neutral, making it easy to spot trend changes.
This indicator is great for spotting trends while ignoring minor price fluctuations, and its MACD-style visuals make it intuitive for traders familiar with momentum indicators
—------------------------------------------------------------------------------------------------------------------
The original script is a TradingView Pine Script (version 4) for an overlay indicator called "Range Filter [DW]". It filters minor price fluctuations to provide a clearer view of trends by calculating a dynamic range around price and gating movements that don't exceed it. It plots a filtered price line, upper/lower bands, fills, and custom bar colors based on trend direction. It's inspired by volatility filters like those in QQE but applied directly to price.
The modified version (updated to Pine Script version 6 by Grok) transforms this into a non-overlay oscillator indicator called "Range Filter Oscillator - MACD Style [DW]". It retains the core range filter logic but repurposes it as an oscillator (normalized between bands) with a MACD-like structure: a fast line, slow line (SMA of the fast line), and a histogram showing their difference. Crossovers and histogram values drive trend signals. This makes it suitable for a separate pane below the chart, focusing on momentum and crossovers rather than overlaying on price. It includes updates for newer Pine Script syntax (e.g., using math. functions, switch statements, and ta. prefix for built-ins).
Both scripts use the Mozilla Public License 2.0 and credit DonovanWall. They share the goal of filtering noise for trend clarity but differ in presentation (overlay vs. oscillator), added MACD-style elements, and some syntax modernizations.
Sürüm Notları
Educational FIRST I want to give full credit to DonovanWall on tradingview. I simply used Grok to make a MACD version, which in my opinion makes it 2 or 3x as powerful! Although I'm not generally a fan of MACD, his indicator is hugely complimented by it. It's better than the normal MACD.
The Range Filter Oscillator - MACD Style is a technical indicator that helps traders identify trends and potential buy or sell signals. It works by smoothing price movements to filter out noise and focuses on significant price changes.
Here's how it works in simple terms:
Range Filter: It calculates a dynamic range around the price, based on user settings (like ATR, price percentage, or ticks). Prices moving outside this range are considered significant.
Oscillator: It measures how far the current price is from the filtered price, creating a value that swings above or below zero, like an oscillator.
MACD-Style: It compares the oscillator (fast line) to its smoothed version (slow line, using a simple moving average). The difference between them forms a histogram, which shows momentum:
Positive histogram (green): Upward momentum, suggesting a buy signal.
Negative histogram (red): Downward momentum, suggesting a sell signal.
Crossovers: When the fast line crosses above the slow line, it indicates a potential buy. When it crosses below, it suggests a sell.
Bar Colors: The chart bars turn green for bullish signals, red for bearish, and gray for neutral, making it easy to spot trend changes.
This indicator is great for spotting trends while ignoring minor price fluctuations, and its MACD-style visuals make it intuitive for traders familiar with momentum indicators
—------------------------------------------------------------------------------------------------------------------
### Overview
The original script is a TradingView Pine Script (version 4) for an overlay indicator called "Range Filter [DW]". It filters minor price fluctuations to provide a clearer view of trends by calculating a dynamic range around price and gating movements that don't exceed it. It plots a filtered price line, upper/lower bands, fills, and custom bar colors based on trend direction. It's inspired by volatility filters like those in QQE but applied directly to price.
The modified version (updated to Pine Script version 6 by Grok) transforms this into a non-overlay oscillator indicator called "Range Filter Oscillator - MACD Style [DW]". It retains the core range filter logic but repurposes it as an oscillator (normalized between bands) with a MACD-like structure: a fast line, slow line (SMA of the fast line), and a histogram showing their difference. Crossovers and histogram values drive trend signals. This makes it suitable for a separate pane below the chart, focusing on momentum and crossovers rather than overlaying on price. It includes updates for newer Pine Script syntax (e.g., using `math.` functions, `switch` statements, and `ta.` prefix for built-ins).
Both scripts use the Mozilla Public License 2.0 and credit DonovanWall. They share the goal of filtering noise for trend clarity but differ in presentation (overlay vs. oscillator), added MACD-style elements, and some syntax modernizations. Below, I'll break down the functionalities/features by section, highlighting similarities and differences.
### Summary of Original vs. Modified Range Filter Scripts
#### Functions
- **Both**: Share core functions for noise filtering:
- **Conditional EMA**: Samples EMA only on conditions (e.g., filter changes), used for smoothing ranges and averaging filter values.
- **Conditional SMA**: Averages values conditionally for standard deviation.
- **Standard Deviation**: Computes sample standard deviation via conditional SMA.
- **Range Size**: Sets filter range based on scales (Points, Pips, Ticks, % of Price, ATR, Average Change, Standard Deviation, Absolute).
- **Range Filter**: Core logic, computes filtered price and bands. Supports Type 1 (adjusts filter based on price exceeding bands) and Type 2 (steps filter in range multiples). Applies optional smoothing and averaging.
- **Original**: Uses Pine Script v4 syntax (e.g., `pow`, no type declarations).
- **Modified**: Same logic, updated to v6 syntax (e.g., `math.pow`, `float[]` types, `switch` for range size). No new functions; modified prefixes with `f_` and returns array for range filter.
**Similarities**: Identical mathematical logic for noise filtering and range calculation.
**Differences**: Modified uses v6 syntax for clarity and compatibility; no functional additions.
#### Inputs
- **Shared**: Filter Type (Type 1/2), Movement Source (Wicks/Close), Range Size (default 2.618), Range Scale (e.g., Average Change), Range Period (14), Smooth Range (true), Smoothing Period (27), Average Filter Changes (false), Number of Changes to Average (2).
- **Modified Adds**: SMA Smoothing Length (default 50) for oscillator’s slow line.
- **Similarities**: Core filter customization unchanged.
- **Differences**: Modified adds SMA length for MACD-style tuning.
#### Definitions
- **Both**: Compute high/low values (`h_val`, `l_val`) from Wicks/Close, range filter values (`h_band`, `l_band`, `filt`).
- **Direction (`fdir`)**:
- **Original**: 1 (up) if filter rises, -1 (down) if falls, else previous.
- **Modified**: Based on oscillator crossovers or histogram sign (>0 up, <0 down).
- **Modified Adds**: Oscillator (`osc`): `(close - filt) / (h_band - filt)`. SMA of oscillator (`sma_osc`). Histogram (`hist`): `osc - sma_osc`.
- **Colors**:
- **Original**: Green/red/gray for filter; bar colors based on close vs. filter.
- **Modified**: White fast line, black slow line, green/red histogram; bar colors by histogram sign.
- **Similarities**: Same filter and direction logic.
- **Differences**: Modified adds MACD-style oscillator calculations and crossover-based direction.
#### Outputs
- **Original (Overlay)**: Plots filter line, bands, fills (green/red); bar colors by trend.
- **Modified (Non-Overlay)**: Plots fast/slow lines, histogram, zero line; bar colors by histogram.
- **Both**: Hidden `fdir` for external use (1 bullish, -1 bearish).
- **Similarities**: Bar coloring and external signal.
- **Differences**: Original overlays on price; modified is a separate oscillator pane with MACD visuals, no bands/fills.
#### Overall
- **Additions**: Modified introduces MACD-style oscillator (lines, histogram, crossovers), SMA length input, v6 syntax.
- **Removals**: Drops overlay bands/fills; simplifies colors.
- **Impact**: Original is trend-following (price overlay); modified focuses on momentum (crossovers/histogram). Core filtering unchanged.
- **No Changes**: Noise reduction logic, input options.
Korumalı komut dosyası
Bu komut dosyası kapalı kaynak olarak yayınlanmaktadır. Ancak, özgürce ve herhangi bir sınırlama olmaksızın kullanabilirsiniz – daha fazla bilgi burada.
Feragatname
Bilgiler ve yayınlar, TradingView tarafından sağlanan veya onaylanan finansal, yatırım, işlem veya diğer türden tavsiye veya tavsiyeler anlamına gelmez ve teşkil etmez. Kullanım Şartları'nda daha fazlasını okuyun.