OPEN-SOURCE SCRIPT
ZScore Plot with Ranked Table
Version 0.1
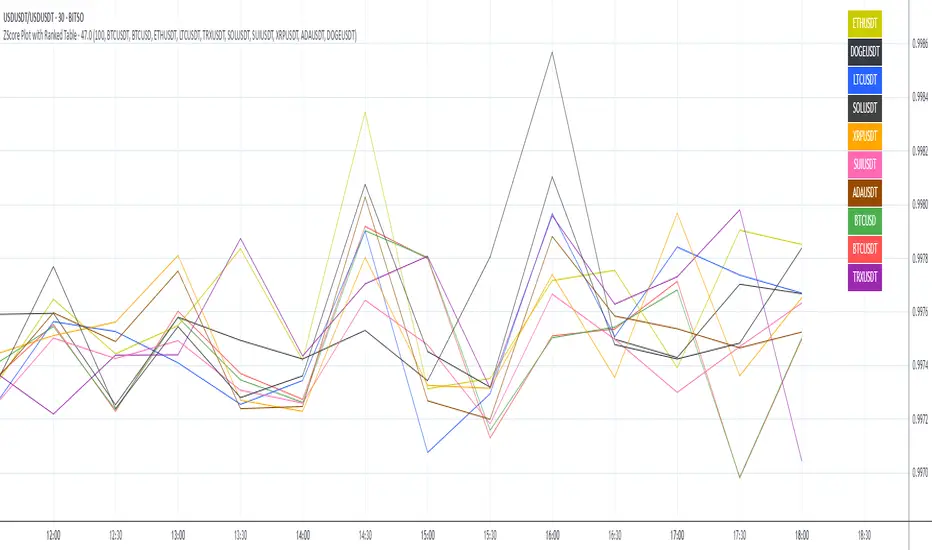
ZScore Plot with Ranked Table — Overview
This indicator visualizes the rolling ZScores of up to 10 crypto assets, giving traders a normalized view of log return deviations over time. It's designed for volatility analysis, anomaly detection, and clustering of asset behavior.
🎯 Purpose
• Show how each asset's performance deviates from its historical mean
• Identify potential overbought/oversold conditions across assets
• Provide a ranked leaderboard to compare asset behavior instantly
⚙️ Inputs
• Lookback: Number of bars to calculate mean and standard deviation
• Asset 1–10: Choose up to 10 symbols (e.g. BTCUSDT, ETHUSDT)
📈 Outputs
• ZScore Lines: Each asset plotted on a normalized scale (mean = 0, SD = 1)
• End-of-Line Labels: Asset names displayed at latest bar
• Leaderboard Table: Ranked list (top-right) showing:
◦ Asset name (color-matched)
◦ Final ZScore (rounded to 3 decimals)
🧠 Use Cases
• Quantitative traders seeking cross-asset momentum snapshots
• Signal engineers tracking volatility clusters
• Risk managers monitoring outliers and systemic shifts
Açık kaynak kodlu komut dosyası
Gerçek TradingView ruhuyla, bu komut dosyasının mimarı, yatırımcıların işlevselliğini inceleyip doğrulayabilmesi için onu açık kaynaklı hale getirdi. Yazarı tebrik ederiz! Ücretsiz olarak kullanabilseniz de, kodu yeniden yayınlamanın Topluluk Kurallarımıza tabi olduğunu unutmayın.
Feragatname
Bilgiler ve yayınlar, TradingView tarafından sağlanan veya onaylanan finansal, yatırım, alım satım veya diğer türden tavsiye veya öneriler anlamına gelmez ve teşkil etmez. Kullanım Koşulları bölümünde daha fazlasını okuyun.