OPEN-SOURCE SCRIPT
ChillLax Relative Strength Line with NewHigh NewLow Blue Dot
This is similar to the IBD MarketSurge (MarketSmith) Blue Dot:
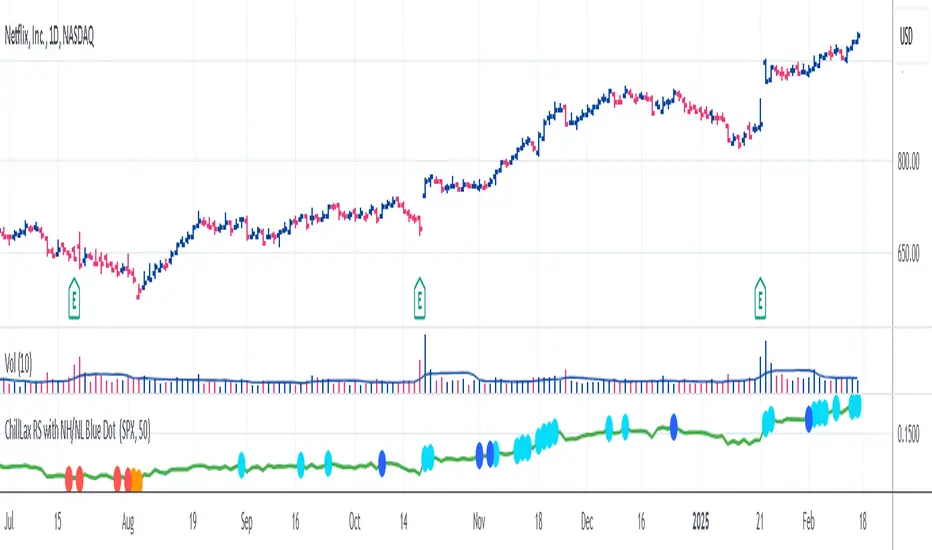
This plots the Relative Strength line vs. an index (default index is SPX), with a Dot when the RS line is hitting a New High.
If the RS hits a New High over the past X bars (default is 50), it shows a Light Blue (user definable) Dot on the RS line, if RS hits New High before the instrument hits New High, it shows a bigger/darker Blue Dot. Reverse for New Lows (orange for RS NL, Red for RS NL before Price NL)
This Dot is similar to the IBD Marketsurge RS New High Blue Dot, this indicator shows all the previous dots (MarketSurge shows only the last one). This on, unlike IBD, also shows RS New Lows. This one distinguishes RS NH before Price NH, and RS NL before Price NL. Lastly, IBD's lookback period is 52 week, here it is default to 50 days, but it is changeable.
Açık kaynak kodlu komut dosyası
Gerçek TradingView ruhuyla, bu komut dosyasının mimarı, yatırımcıların işlevselliğini inceleyip doğrulayabilmesi için onu açık kaynaklı hale getirdi. Yazarı tebrik ederiz! Ücretsiz olarak kullanabilseniz de, kodu yeniden yayınlamanın Topluluk Kurallarımıza tabi olduğunu unutmayın.
Feragatname
Bilgiler ve yayınlar, TradingView tarafından sağlanan veya onaylanan finansal, yatırım, alım satım veya diğer türden tavsiye veya öneriler anlamına gelmez ve teşkil etmez. Kullanım Koşulları bölümünde daha fazlasını okuyun.