PROTECTED SOURCE SCRIPT
Güncellendi MomentumQ Breadth
MomentumQ Breadth Indicator
The MomentumQ Breadth Indicator is a powerful, user-friendly tool designed to help traders analyze market breadth for two major indices: S&P 500 and NASDAQ, with customizable time frames to suit various trading strategies. This indicator aims to provide valuable insights into market momentum, helping traders identify bullish, neutral, and bearish conditions with ease.
How It Works:
Symbols used:
Key Features:
Concepts and Calculations:
The indicator fetches market breadth data from predefined symbols based on the user’s selection. Breadth indicators measure the degree of participation in the market, offering valuable insights into overall market strength or weakness. This tool allows traders to identify overbought or oversold conditions and better understand the prevailing market trend.
How to Use:
Why It’s Useful:
The MomentumQ Breadth Indicator adds significant value to traders by:
The MomentumQ Breadth Indicator is a powerful, user-friendly tool designed to help traders analyze market breadth for two major indices: S&P 500 and NASDAQ, with customizable time frames to suit various trading strategies. This indicator aims to provide valuable insights into market momentum, helping traders identify bullish, neutral, and bearish conditions with ease.
How It Works:
- Index Selection:
Users can choose between S&P 500 and NASDAQ indices, allowing for flexibility in market analysis. - Time Period Customization:
Choose between 20-Day or 50-Day periods to analyze short-term or medium-term market breadth trends. - Dynamic Symbol Mapping:
The script dynamically fetches data for the selected index and time frame using TradingView's request.security() function.
Symbols used:
- S&P 20-Day: S5TW
- S&P 50-Day: S5FI
- NASDAQ 20-Day: NDTW
- NASDAQ 50-Day: NDFI
Key Features:
- Dynamic Configuration:
Through intuitive dropdown menus, users can easily select their desired index and time period directly from the settings. - Visual Representation:
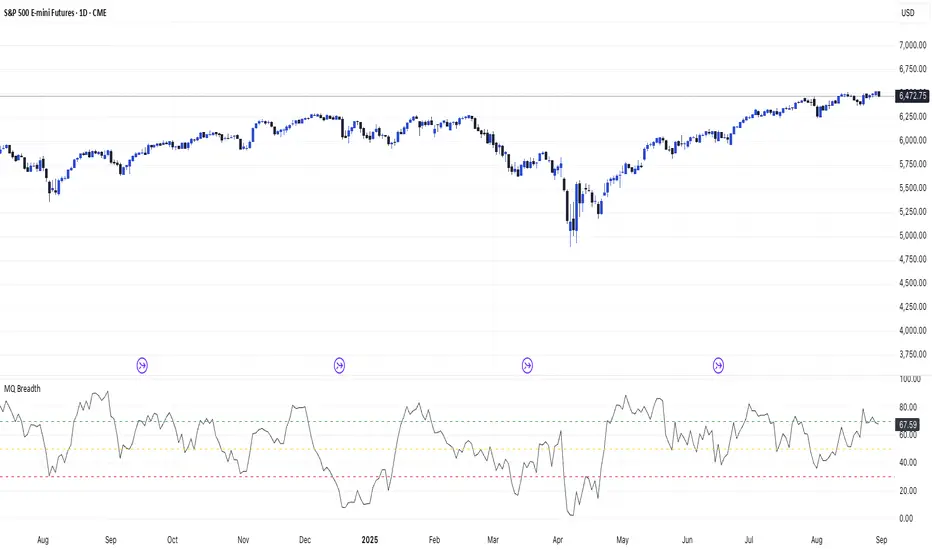
A clean, blue line plot represents the selected breadth data, dynamically updating based on user input. - Threshold Levels:
Horizontal lines mark key levels to interpret market sentiment:
Bullish (>70): Indicates strong upward momentum.
Neutral (50): Suggests balanced or uncertain market conditions.
Bearish (<30): Signals potential downward momentum. - User-Friendly Design:
No complex configurations required; the dropdown options make it simple to adapt the indicator to your needs.
Concepts and Calculations:
The indicator fetches market breadth data from predefined symbols based on the user’s selection. Breadth indicators measure the degree of participation in the market, offering valuable insights into overall market strength or weakness. This tool allows traders to identify overbought or oversold conditions and better understand the prevailing market trend.
How to Use:
- Open the indicator settings.
- Select the desired Index: Choose between "S&P" or "NASDAQ."
- Select the desired Time Period: Choose between "20-Day" or "50-Day."
- Observe the plotted breadth line and interpret it in conjunction with the threshold levels:
Bullish (>70): Momentum is strongly upward.
Neutral (50): Momentum is balanced or uncertain.
Bearish (<30): Momentum is strongly downward. - Incorporate the insights from this indicator into your trading strategy to better time entries, exits, or to confirm market trends.
Why It’s Useful:
The MomentumQ Breadth Indicator adds significant value to traders by:
- Allowing flexible customization for different indices and time frames.
- Providing clear thresholds for market sentiment to guide decision-making.
- Offering a user-friendly interface suitable for traders of all levels.
Sürüm Notları
MomentumQ Breadth UpdateVersion: V1.1
Release Date: 22.01.2025
This update significantly expands the MomentumQ Breadth Indicator, introducing new indices and extended moving average timeframes, allowing for a more comprehensive market breadth analysis.
What's New:
Expanded Index Coverage
- Added support for Dow Jones Industrial Average (DJIA) and Russell 2000, in addition to S&P 500 and NASDAQ.
- Users can now analyze a broader set of market indices to assess overall market participation and strength.
Additional Time Period Selections
- Expanded time period options to include 5-Day, 100-Day, 150-Day, and 200-Day moving averages.
- These additions provide deeper insights into short-term momentum shifts and long-term trend stability.
Updated Symbol Mapping for New Indices
Dow Jones Industrial (DJIA) Symbols:
- 5-Day: DIFD
- 20-Day: DITW
- 50-Day: DIFI
- 100-Day: DIOH
- 150-Day: DIOF
- 200-Day: DITH
Russell 2000 Symbols:
- 5-Day: R2FD
- 20-Day: R2TW
- 50-Day: R2FI
- 100-Day: R2OH
- 150-Day: R2OF
- 200-Day: R2TH
Enhanced Customization and Symbol Mapping
- The indicator dynamically selects the correct breadth symbol based on the chosen index and time period, ensuring accurate market data retrieval.
- More refined breadth tracking enables users to assess market-wide sentiment and participation rates across multiple indices.
Instructions for Traders
Update Your Indicator: Ensure you have the latest version of MomentumQ Breadth to take advantage of the expanded indices and additional moving average periods.
Explore New Settings:
- Select from a wider range of indices (S&P 500, NASDAQ, Russell 2000, and Dow Jones Industrial Average).
- Customize timeframes from 5-Day to 200-Day for more tailored breadth analysis.
Disclaimer:
The MomentumQ Breadth Indicator is designed to assist in market trend analysis but does not guarantee profitability. Market conditions vary, and risk management is essential. Past results do not predict future performance. Consult a financial advisor if necessary.
Thank You for Your Support!
Your support and feedback are greatly appreciated. This is a free tool designed to help traders analyze market breadth with flexibility and ease. We will continue to improve and refine it to provide valuable market insights.
Sürüm Notları
Update – V1.2Made small design improvements:
Added light/dark mode option for better theme compatibility.
Please remove the indicator and add it again to load the update.
Feel free to share feedback if anything still needs improvement.
Korumalı komut dosyası
Bu komut dosyası kapalı kaynak olarak yayınlanmaktadır. Ancak, özgürce ve herhangi bir sınırlama olmaksızın kullanabilirsiniz – daha fazla bilgi burada.
Feragatname
Bilgiler ve yayınlar, TradingView tarafından sağlanan veya onaylanan finansal, yatırım, işlem veya diğer türden tavsiye veya tavsiyeler anlamına gelmez ve teşkil etmez. Kullanım Şartları'nda daha fazlasını okuyun.