OPEN-SOURCE SCRIPT
Polynomial Regression Slope [QTL]
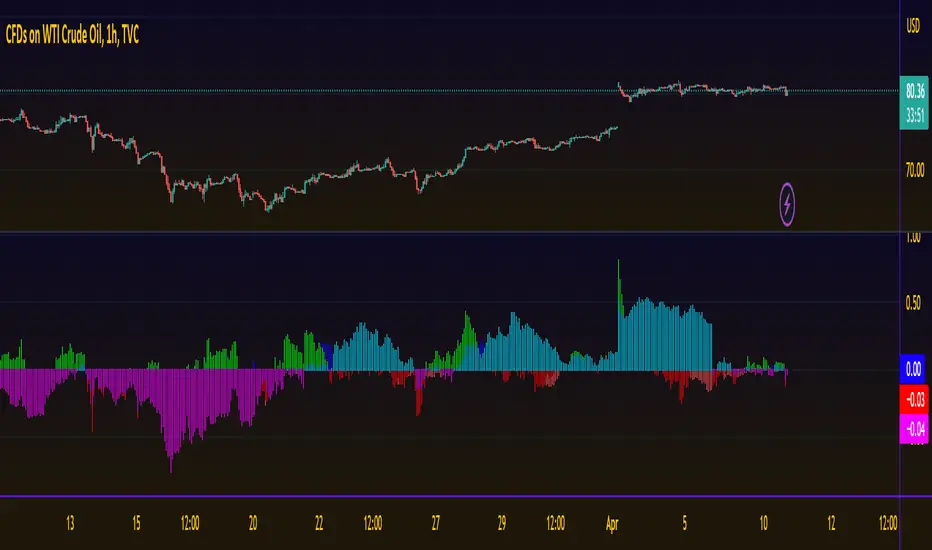
The Polynomial Regression Slope Indicator is a versatile and powerful tool for traders seeking to identify trends and potential entry or exit points in the market. By fitting a polynomial function to a dataset, this indicator can provide insights into the direction and strength of a trend over a specified time period. The indicator allows users to select the degree of the polynomial (1 for linear, 2 for quadratic, and 3 for cubic) to match their trading style and the characteristics of the market they are trading in.
While higher-degree polynomials can offer a better fit to the data, we recommend using a polynomial of degree less than 3 for the sake of stability and to avoid overfitting. Overfitting occurs when a model captures the noise in the data rather than the underlying trend, leading to false signals and decreased predictive power.
Slope is an important aspect of trading as it represents the rate of change of an asset's price over time. A positive slope indicates an upward trend, while a negative slope suggests a downward trend. By using the Polynomial Regression Slope Indicator, traders can better understand the current market dynamics, identify potential reversals or continuation patterns, and make informed decisions on when to enter or exit a position.
Açık kaynak kodlu komut dosyası
Gerçek TradingView ruhuyla, bu komut dosyasının mimarı, yatırımcıların işlevselliğini inceleyip doğrulayabilmesi için onu açık kaynaklı hale getirdi. Yazarı tebrik ederiz! Ücretsiz olarak kullanabilseniz de, kodu yeniden yayınlamanın Topluluk Kurallarımıza tabi olduğunu unutmayın.
Feragatname
Bilgiler ve yayınlar, TradingView tarafından sağlanan veya onaylanan finansal, yatırım, alım satım veya diğer türden tavsiye veya öneriler anlamına gelmez ve teşkil etmez. Kullanım Koşulları bölümünde daha fazlasını okuyun.