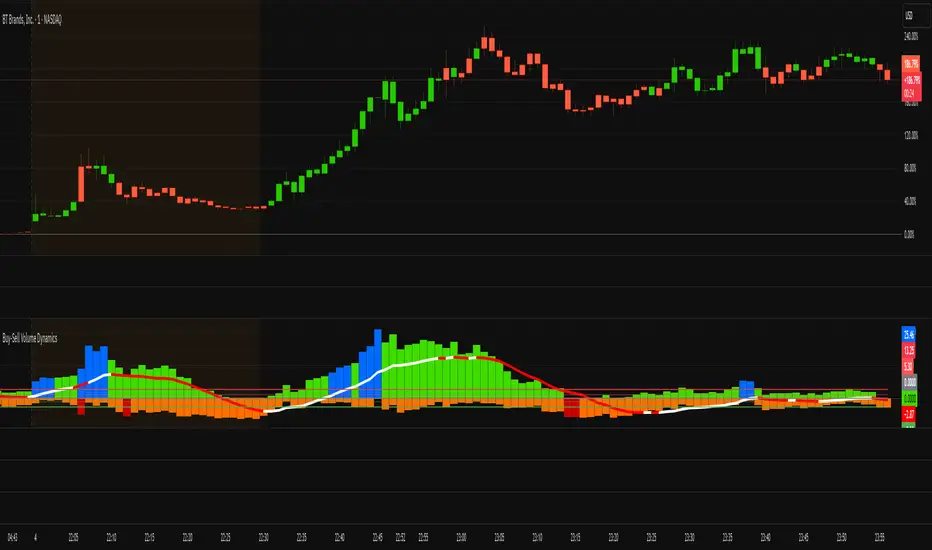
<163> 25_0804 Buy-Sell Volume Dynamics

Purpose:
Detect extreme fear (bottom) → Buying opportunity
Detect overheating (top) → Sell warning
How it works:
WVF (Williams VIX Fix) is calculated based on the highest and lowest closing prices
If the WVF exceeds or falls below certain thresholds (sDev, rangeHigh/Low), it is visualized
Outputs are shown as columns: Buy Pressure, Buy Timing, Max Sell Pressure, and Sell Pressure
Application:
Short-term plunge → Potential dip-buying timing
Sharp rise / overbought → Profit-taking or shorting opportunity
✅ 2. Net Buy/Sell Transaction Value Calculation
Purpose:
Confirm real supply-demand dominance
How it works:
Daily transaction value is calculated using average price and volume
Net buy/sell volume is calculated by subtracting previous day’s accumulated volume
If buy volume crosses over sell volume → Buy signal shown via flag
Application:
Strong intraday buy pressure → Entry confirmation
Dominant selling → Use caution or avoid entry
✅ 3. Trend Reversal Line & WaveTrend Analysis
📌 Trend Reversal Line (PRICE_AVG)
Applies a moving average (user-selectable: SMA, EMA, WMA, DEMA, TEMA) to the average of WVF buy/sell columns
Analyzes slope (change) to detect trend reversals
→ Positive slope: Bullish trend
→ Negative slope: Bearish trend
→ Displayed with thick lines for emphasis
📌 WaveTrend (WT) Oscillator
Momentum calculated using Ehler’s WaveTrend method
→ Overbought/Oversold zones marked
→ WT1 > WT2: Bullish momentum
→ WT1 < WT2: Bearish momentum
Application:
Positive PRICE_AVG slope + WT crossover upward → Strong buy signal
Overheated WT + WVF sell pressure → Profit-taking or exit warning
📊 Chart Display Summary
Element Visualization Method
Buy/Sell Pressure Column style (plot.style_columns)
Trend Line Moving average with slope coloring (plot)
WaveTrend Lines and clouds (plot + fill)
Candle Coloring Green/Red based on trend slope
Signal Markers plotshape, bgcolor for buy/sell cues
🧠 Strategy Summary
Scenario Entry/Exit Judgment
📉 WVF drops + PRICE_AVG upward slope Buy entry
📈 WVF spike + WT overbought Sell/Exit or hold cautiously
💹 Buy volume > Sell volume crossover Confirm buy momentum
📉 PRICE_AVG downward slope + WT downward crossover Sell reversal / defensive mode
🔚 Summary:
This indicator integrates fear/greed psychology, real transaction flow, trend reversal, and momentum signals into a comprehensive visualization tool. It is particularly effective for intraday and swing traders, allowing identification of high-probability entry points when multiple signals align.
Yalnızca davetli komut dosyası
Bu komut dosyasına yalnızca yazar tarafından onaylanan kullanıcılar erişebilir. Kullanmak için izin istemeniz ve almanız gerekir. Bu izin genellikle ödeme yapıldıktan sonra verilir. Daha fazla ayrıntı için aşağıdaki yazarın talimatlarını izleyin veya doğrudan tobaco72 ile iletişime geçin.
TradingView, yazarına tam olarak güvenmediğiniz ve nasıl çalıştığını anlamadığınız sürece bir komut dosyası için ödeme yapmanızı veya kullanmanızı ÖNERMEZ. Ayrıca topluluk komut dosyaları bölümümüzde ücretsiz, açık kaynaklı alternatifler bulabilirsiniz.
Yazarın talimatları
Uyarı: Erişim talebinde bulunmadan önce lütfen yalnızca davetli komut dosyaları kılavuzumuzu okuyun.
Feragatname
Yalnızca davetli komut dosyası
Bu komut dosyasına yalnızca yazar tarafından onaylanan kullanıcılar erişebilir. Kullanmak için izin istemeniz ve almanız gerekir. Bu izin genellikle ödeme yapıldıktan sonra verilir. Daha fazla ayrıntı için aşağıdaki yazarın talimatlarını izleyin veya doğrudan tobaco72 ile iletişime geçin.
TradingView, yazarına tam olarak güvenmediğiniz ve nasıl çalıştığını anlamadığınız sürece bir komut dosyası için ödeme yapmanızı veya kullanmanızı ÖNERMEZ. Ayrıca topluluk komut dosyaları bölümümüzde ücretsiz, açık kaynaklı alternatifler bulabilirsiniz.
Yazarın talimatları
Uyarı: Erişim talebinde bulunmadan önce lütfen yalnızca davetli komut dosyaları kılavuzumuzu okuyun.