OPEN-SOURCE SCRIPT
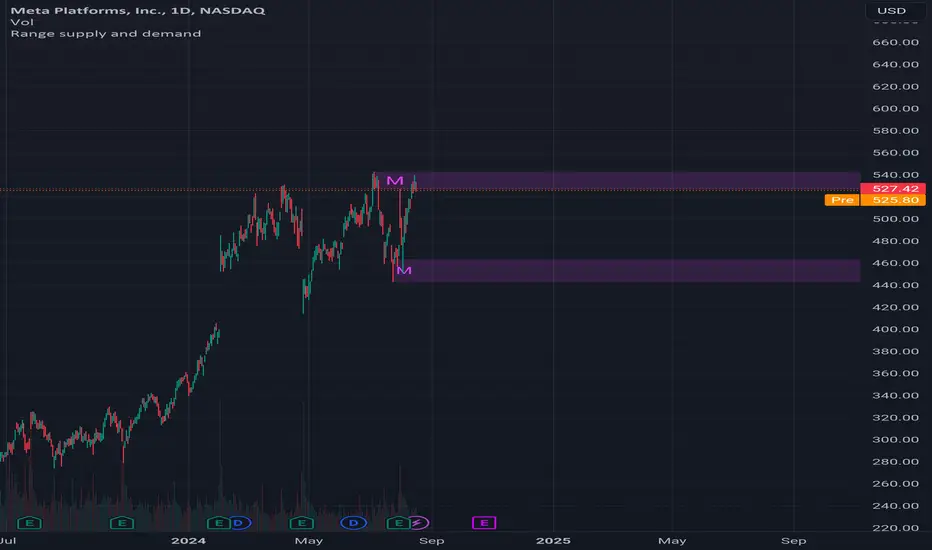
Range supply and demand
Hi all!
This is a very simple indicator. It plots the high timeframe (configurable via the "Timeframe" setting) high/low current timeframe bars (that has the same high/low as the higher timeframe) as supply/demand. The higher timeframe bar that's chosen is the one that's next last. As of now one high and one low zone is plotted.
The defaults are based on useful zones when on daily candles.
You can choose to display the higher timeframe within the zone via the "Show" option.
Hope this is clear enough, let me know otherwise.
Best of luck trading!
Açık kaynak kodlu komut dosyası
Gerçek TradingView ruhuyla, bu komut dosyasının mimarı, yatırımcıların işlevselliğini inceleyip doğrulayabilmesi için onu açık kaynaklı hale getirdi. Yazarı tebrik ederiz! Ücretsiz olarak kullanabilseniz de, kodu yeniden yayınlamanın Topluluk Kurallarımıza tabi olduğunu unutmayın.
Feragatname
Bilgiler ve yayınlar, TradingView tarafından sağlanan veya onaylanan finansal, yatırım, alım satım veya diğer türden tavsiye veya öneriler anlamına gelmez ve teşkil etmez. Kullanım Koşulları bölümünde daha fazlasını okuyun.