Technical Analysis of SALIK COMPANY PJ (SALIK)This is a daily chart for Salik Company (SALIK) - UAE showing a bullish technical analysis setup.
Analysis Breakdown:
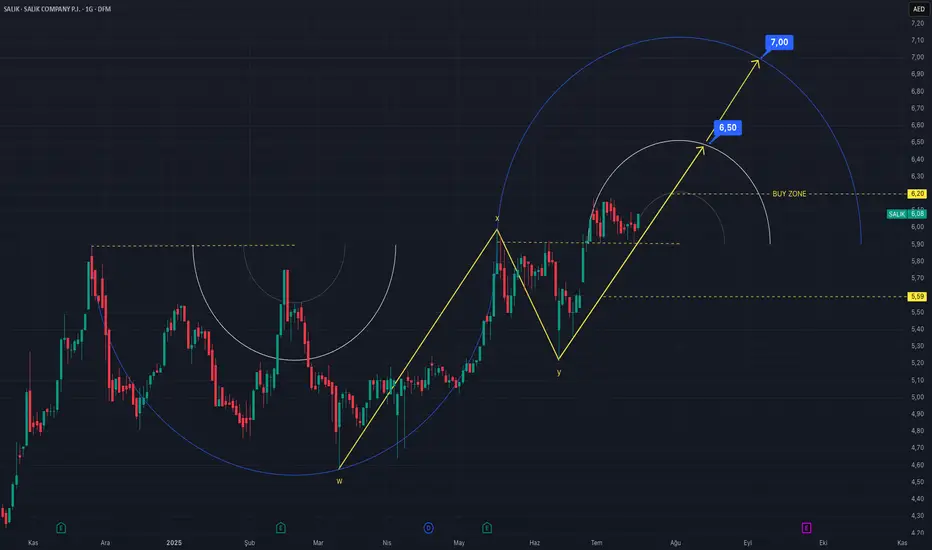
Pattern Identification: The analyst has identified a complex corrective pattern labeled as "W-X-Y." This is a type of Elliott Wave correction, suggesting that a longer-term downtrend or consolidation phase has completed at the point marked "Y".
New Uptrend: Following the completion of the "Y" wave at a low point, the stock has started a new upward trend, indicated by the rising yellow trendline.
Support and Entry:
The yellow trendline starting from the "Y" low is acting as the primary dynamic support for the current rally.
A "BUY ZONE" is marked around the 5.20 price level. The analyst suggests this area as a potential entry point for a long (buy) position, likely anticipating a minor pullback to this zone before the next leg up.
Price Targets: The analysis projects two potential upward targets, seemingly derived from the intersection of the rising trendline and the large blue arcs (which could be Fibonacci or Gann arcs):
First Target (PT1): 6.50
Second Target (PT2): 7.00
Tools Used: The chart uses trendlines, Elliott Wave patterns (W-X-Y), and circular arcs to identify the trend, support/resistance levels, and future price objectives.
Summary:
The overall sentiment of this chart is bullish. The analysis suggests that Salik's stock has finished its correction and has now entered a new upward phase. The key strategy presented is to enter a buy position around the 5.20 "BUY ZONE," with expectations for the price to rise towards the 6.50 and subsequently the 7.00 targets in the medium term.
Disclaimer: This is an interpretation of the technical analysis presented in the image. It is not financial advice.
Dubai stock exchange Grafik çok hosuma gitti oyuzden paylasiyorum. Arkadaşlar ileriki zamanlarda london,hong kong stock exchange gibi başarılı olur mu bu dubai borsası? Yorumlarınızı merak ediyorum

EMAAR Formasyon + GöstergeÇok beğendim, uzun vadeli yatırım arayanlara... Şahsi eğitim çalışmamdır, yatırım tavsiyesi içermez. Teknik analiz eğitim notları içeren paylaşımlara ve teknik analiz eğitim e-kitabına profilimdeki Twitter hesabım üzerinden ulaşabilirsiniz.
