#AFYONSon dönemde yatayda devam etmekte 15 lere gelebilir, kırması durumunda yukarı atar yada direnci kıramaz ise geri döner şuan için azda olsa marj var gibi
IO komut dosyası içerir

AXSUSDT // Fiyatlar uzun zaman sonra kaufman indikatörünün üstünde.Kar al noktamız haftalık zaman diliminde kama indikatörü.Zarar kes günlük zaman diliminde kama altında olabilecek kapanışlar.
Paylaşım yaptığımda size email gelmiyorsa sırasıyla profil ayarları-bildirimler-takip ettiğiniz yazarlar altında bulunan eposta seçeneklerinin seçili olmasına dikkat edin.
ÖNEMLİ NOT :
-İşlemlerinizde kar ne kadar önemli ise STOP noktanız da o kadar önemlidir mutlaka STOP kullanın.
-Burada analizini paylaştığım hiçbir hissenin , alım-satımını şahsen yapmıyorum. Bu hisseyi veya başka bir hisseyi , benim aldığımı düşünerek alım yapmayınız.
-Sizlerden rica ederim eğitim amaçlı paylaştığım grafiklerde nereden alınıp nereden satılmasını sormayınız bu işlem yatırım danışmanlığına girer ve bu işi yetkili insanlar yapıyor.Ben yatırım danışmanı değilim.
-Bu analiz tamamen benim öngörüm eğitim çalışmasıdır amacım Teknik analize başlamış yada başlayacak olanlara yol göstermek.Böyle olacak diye bir kaide yoktur. Sonucunda oluşabilecek zararlardan kesinlikle sorumlu değilim. Kendi kararınızı kendiniz veriniz. Saygılarımla.

KONYA//HAFTALIKKONYA haftalık grafikte kırılım gelmiş. Rsi olumlu ama macd 0 üzerine atamamış. 6100 tl sopla takip edilebilir.
Bu bir yatırım tavsiyesi değildir.

GLRMK//HAFTALIKGLRMK haftalık son mum güzel. Yeni halka arz olduğu için grafikte çizilecek bir şey yok.
Bu yüzden fibonacci rakamlarına göre takip edeceğiz. Altta fibo 0,5 ve 0,382 destek. Fibo 1 ve 1,272 kısa hedefleri
Bu bir yatırım tavsiyesi değildir.

BRSAN//HAFTALIKBRSAN bir kaç kere trend çizgisini kırmayı denedi ama başaramadı. Bu kez kıracak mı izleyelim. Yükselişin kalıcı olması için 410 tl üzerinde 2 gün kalıcı olması gerek. Direnci geçemezse 360 tl bölgesine geri çekilme yapabilir.
Bu bir yatırım tavsiyesi değildir.

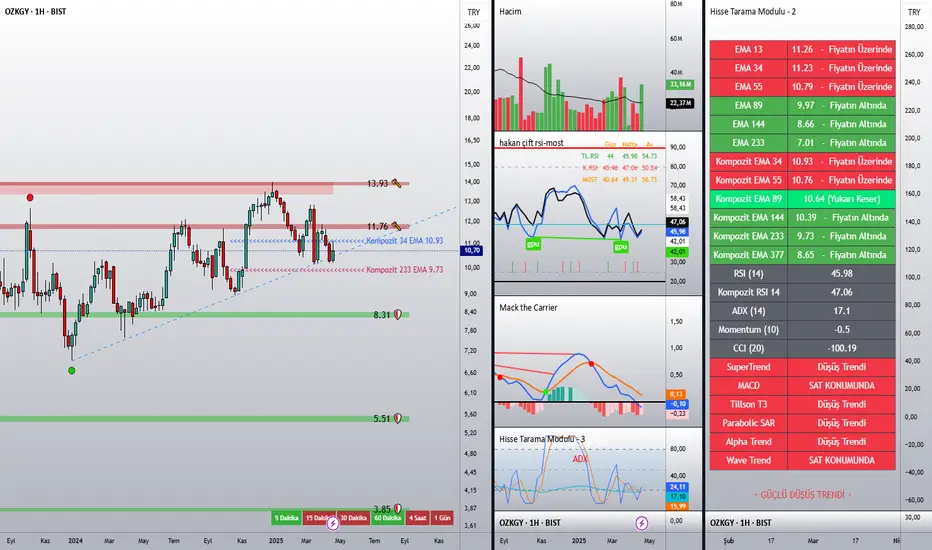
OZKGY//HAFTALIKOZKGY destek üzerinde kalmayı başarmış ve haftalık grafiğinde hamile boğa formasyonu var. 9,70 tl stop olmak şartıyla takip edilebilir.
Bu bir yatırım tavsiyesi değildir.
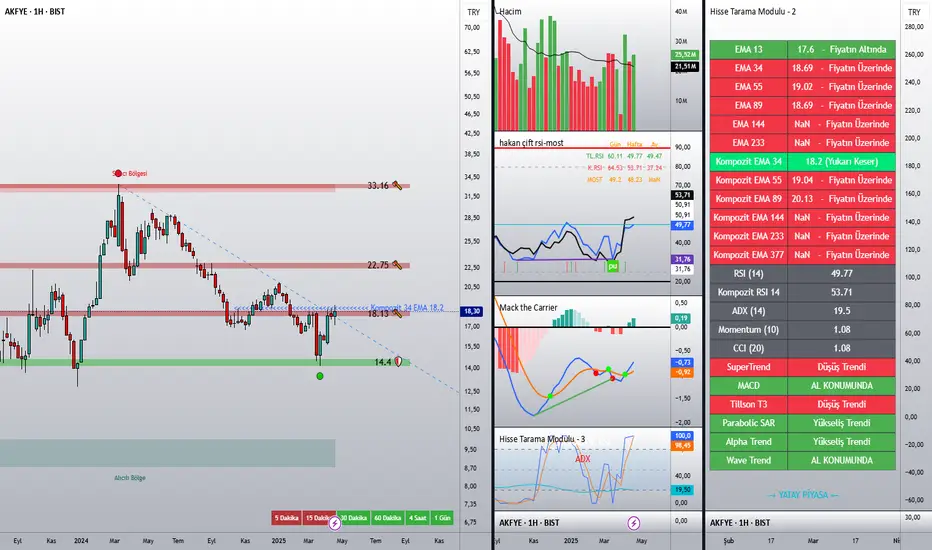
AKFYE//HAFTALIKAKFYE haftalık grafiğinde eğer geri çekilme yapmazsa düşeni kırmak üzere. Göstergeler henüz olumlu değil. Fiyat bir çok Ema'nın altında. İşlem yapmak isteyenler 17,16 tl stoplu işlem yapabilirler
Bu bir yatırım tavsiyesi değildir.
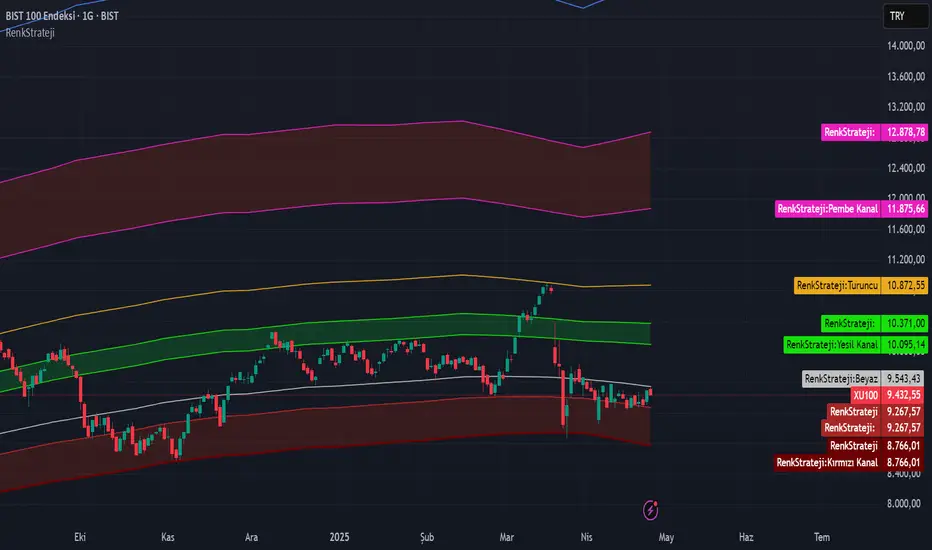
Bist100 için tehlikeli duruş#bist100 Kırmızı kanaldan sürekli tepki alıp üstünde kalmaya devam ediyoruz ama acilen kendimizi üstteki gapı kapatmaya yeşil kanala birkaç zig zag yapmamız lazım. Yoksa üzülerek söylüyorum bu işin sonu kırmızı kanalın altı ve uzun bir süre bizi paramızla rezil ederler.
BNTUSDT //Fiyatlar uzun zaman sonra kaufman indikatörünün üstünde.Kar al noktamız haftalık zaman diliminde kama indikatörü.Zarar kes günlük zaman diliminde kama altında olabilecek kapanışlar.
Paylaşım yaptığımda size email gelmiyorsa sırasıyla profil ayarları-bildirimler-takip ettiğiniz yazarlar altında bulunan eposta seçeneklerinin seçili olmasına dikkat edin.
ÖNEMLİ NOT :
-İşlemlerinizde kar ne kadar önemli ise STOP noktanız da o kadar önemlidir mutlaka STOP kullanın.
-Burada analizini paylaştığım hiçbir hissenin , alım-satımını şahsen yapmıyorum. Bu hisseyi veya başka bir hisseyi , benim aldığımı düşünerek alım yapmayınız.
-Sizlerden rica ederim eğitim amaçlı paylaştığım grafiklerde nereden alınıp nereden satılmasını sormayınız bu işlem yatırım danışmanlığına girer ve bu işi yetkili insanlar yapıyor.Ben yatırım danışmanı değilim.
-Bu analiz tamamen benim öngörüm eğitim çalışmasıdır amacım Teknik analize başlamış yada başlayacak olanlara yol göstermek.Böyle olacak diye bir kaide yoktur. Sonucunda oluşabilecek zararlardan kesinlikle sorumlu değilim. Kendi kararınızı kendiniz veriniz. Saygılarımla.

ETH/USDT için spot alım sinyali oluşturduk ETH/USDT için spot alım sinyali oluşturduk ve SuperLuxAlgo desteğiyle siz değerli takipçilerimiz için önemli bir fırsat sunduk! 🚀
Grafikte de gördüğünüz gibi, ETH/USDT paritesinde önemli bir alım bölgesine girdik. Bu fırsatı kaçırmamak için hemen işlem yapmayı düşünebilirsiniz. SuperLuxAlgo'nun güçlü göstergeleriyle, doğru zamanda alım yaparak potansiyel kazanç sağlama şansınız artabilir.
Alım seviyesi: 1. Destek bölgesi
Grafik: Burada ETH'nin güçlü bir destek seviyesini test ettiğini görebilirsiniz, bu da bir alım fırsatı olduğunu gösteriyor. Fiyatın daha fazla düşmesi durumunda bir 'stop loss' belirlemek de önemli olacaktır.
🔔 Önemli Hatırlatmalar:
1. Risk Yönetimi: Her zaman kendi risk yönetimi stratejilerinizi kullanarak işlem yapın.
2. Araştırma: Sadece sinyalleri takip etmekle kalmayın, aynı zamanda kendi araştırmalarınızı da yapın.
Sizler için en iyi fırsatları sunmaya devam edeceğiz! 📈
👉 Bizi takip edin, daha fazla analiz ve spot sinyal için SuperLuxAlgo'yu kullanmaya devam edin!
#ETH #ETHUSDT #Kripto #Bitcoin #Altcoin #SuperLuxAlgo #Trading #CryptoAnalysis #Yatırım #KriptoPara #Sinyaller

BTC DİKKAT !! Borsalara Yüklü Bitcoin Giriyor !!DİKKAT Borsalara Yüklü Bitcoin Giriyor DİKKAT Borsalara Yüklü Bitcoin Giriyor DİKKAT Borsalara Yüklü Bitcoin Giriyor DİKKAT Borsalara Yüklü Bitcoin Giriyor DİKKAT Borsalara Yüklü Bitcoin Giriyor

Bitcoin ve Altcoinler Yükselişini Devam Ettirecek mi?Dibi buldukSelam dostlar, Bitcoin ve Altcoinlerdeki yükseliş ivmesi devam ederken morallerimizin yüksek olduğunu düşünüyorum. Dibi güzel yakaladık ve yolumuza devam ediyoruz. Bugünün detaylı video analizinde nelerden bahsettik?
İlk olarak tabi ki kritik önem taşıyan destek bölgelerimizden bahsettik hem 4H'de hem de günlük grafik yapılarında. Bu seviyeleri mutlaka not alarak ilerleyelim. Ardından Tether hakimiyetine göz attık. Bitcoin dominansındaki durumu analiz ederken total3 ve others grafiklerindeki son duruma bir göz attık. 2. ve 3 kademeli altcoin alımlarımızın hangi bölgelerden satın alacağımla ilgilide videoda açıklamalarda bulundum. Dolu dolu bir teknik analiz videosu oldu. Videoyu beğenirseniz lütfen beğen tuşuna basmayı ve yorum yazmayı unutmayın dostlar... Yeni videolarda görüşmek üzere...

SHIBUSDT // Fiyatlar uzun zaman sonra kaufman indikatörünün üstünde.Kar al noktamız haftalık zaman diliminde kama indikatörü.Zarar kes günlük zaman diliminde kama altında olabilecek kapanışlar.
Paylaşım yaptığımda size email gelmiyorsa sırasıyla profil ayarları-bildirimler-takip ettiğiniz yazarlar altında bulunan eposta seçeneklerinin seçili olmasına dikkat edin.
ÖNEMLİ NOT :
-İşlemlerinizde kar ne kadar önemli ise STOP noktanız da o kadar önemlidir mutlaka STOP kullanın.
-Burada analizini paylaştığım hiçbir hissenin , alım-satımını şahsen yapmıyorum. Bu hisseyi veya başka bir hisseyi , benim aldığımı düşünerek alım yapmayınız.
-Sizlerden rica ederim eğitim amaçlı paylaştığım grafiklerde nereden alınıp nereden satılmasını sormayınız bu işlem yatırım danışmanlığına girer ve bu işi yetkili insanlar yapıyor.Ben yatırım danışmanı değilim.
-Bu analiz tamamen benim öngörüm eğitim çalışmasıdır amacım Teknik analize başlamış yada başlayacak olanlara yol göstermek.Böyle olacak diye bir kaide yoktur. Sonucunda oluşabilecek zararlardan kesinlikle sorumlu değilim. Kendi kararınızı kendiniz veriniz. Saygılarımla.

GMXUSDT // FİNCAN KULP FORMASYONUYeşil çizgi üzerinde kapanışlar görmemiz şart.İlk kar al noktamız yükselişin fibo 1.414 denk gelen 19.68.İkinci kar al noktamız çanak boyunun yüksekliği kadar olan kısım 24.02.
Paylaşım yaptığımda size email gelmiyorsa sırasıyla profil ayarları-bildirimler-takip ettiğiniz yazarlar altında bulunan eposta seçeneklerinin seçili olmasına dikkat edin.
ÖNEMLİ NOT :
-İşlemlerinizde kar ne kadar önemli ise STOP noktanız da o kadar önemlidir mutlaka STOP kullanın.
-Burada analizini paylaştığım hiçbir hissenin , alım-satımını şahsen yapmıyorum. Bu hisseyi veya başka bir hisseyi , benim aldığımı düşünerek alım yapmayınız.
-Sizlerden rica ederim eğitim amaçlı paylaştığım grafiklerde nereden alınıp nereden satılmasını sormayınız bu işlem yatırım danışmanlığına girer ve bu işi yetkili insanlar yapıyor.Ben yatırım danışmanı değilim.
-Bu analiz tamamen benim öngörüm eğitim çalışmasıdır amacım Teknik analize başlamış yada başlayacak olanlara yol göstermek.Böyle olacak diye bir kaide yoktur. Sonucunda oluşabilecek zararlardan kesinlikle sorumlu değilim. Kendi kararınızı kendiniz veriniz. Saygılarımla.

NMRUSDT // Fiyatlar uzun zaman sonra kaufman indikatörünün üstünde.Kar al noktamız haftalık zaman diliminde kama indikatörü.Zarar kes günlük zaman diliminde kama altında olabilecek kapanışlar.
Paylaşım yaptığımda size email gelmiyorsa sırasıyla profil ayarları-bildirimler-takip ettiğiniz yazarlar altında bulunan eposta seçeneklerinin seçili olmasına dikkat edin.
ÖNEMLİ NOT :
-İşlemlerinizde kar ne kadar önemli ise STOP noktanız da o kadar önemlidir mutlaka STOP kullanın.
-Burada analizini paylaştığım hiçbir hissenin , alım-satımını şahsen yapmıyorum. Bu hisseyi veya başka bir hisseyi , benim aldığımı düşünerek alım yapmayınız.
-Sizlerden rica ederim eğitim amaçlı paylaştığım grafiklerde nereden alınıp nereden satılmasını sormayınız bu işlem yatırım danışmanlığına girer ve bu işi yetkili insanlar yapıyor.Ben yatırım danışmanı değilim.
-Bu analiz tamamen benim öngörüm eğitim çalışmasıdır amacım Teknik analize başlamış yada başlayacak olanlara yol göstermek.Böyle olacak diye bir kaide yoktur. Sonucunda oluşabilecek zararlardan kesinlikle sorumlu değilim. Kendi kararınızı kendiniz veriniz. Saygılarımla.

CTCUSDT // Fiyatlar uzun zaman sonra kaufman indikatörünün üstünde.Kar al noktamız haftalık zaman diliminde kama indikatörü.Zarar kes günlük zaman diliminde kama altında olabilecek kapanışlar.
Paylaşım yaptığımda size email gelmiyorsa sırasıyla profil ayarları-bildirimler-takip ettiğiniz yazarlar altında bulunan eposta seçeneklerinin seçili olmasına dikkat edin.
ÖNEMLİ NOT :
-İşlemlerinizde kar ne kadar önemli ise STOP noktanız da o kadar önemlidir mutlaka STOP kullanın.
-Burada analizini paylaştığım hiçbir hissenin , alım-satımını şahsen yapmıyorum. Bu hisseyi veya başka bir hisseyi , benim aldığımı düşünerek alım yapmayınız.
-Sizlerden rica ederim eğitim amaçlı paylaştığım grafiklerde nereden alınıp nereden satılmasını sormayınız bu işlem yatırım danışmanlığına girer ve bu işi yetkili insanlar yapıyor.Ben yatırım danışmanı değilim.
-Bu analiz tamamen benim öngörüm eğitim çalışmasıdır amacım Teknik analize başlamış yada başlayacak olanlara yol göstermek.Böyle olacak diye bir kaide yoktur. Sonucunda oluşabilecek zararlardan kesinlikle sorumlu değilim. Kendi kararınızı kendiniz veriniz. Saygılarımla.


VKFYOHaftalık grafikte DÜŞEN KANAL TRENDİ formasyonu bulunduran hissede MACD 0 üzerine atmak üzere iken SAFAKHOMETECHNICAL fibo çizgileri destek ve direnç olarak takip edilebilir. YTD...

JASMYUSDT // FİNCAN KULP FORMASYONUMavi çizgi üzerinde kapanışlar görmemiz şart.İlk kar al noktamız yükselişin fibo 1.414 denk gelen 0.0021049.İkinci kar al noktamız çanak boyunun yüksekliği kadar olan kısım 0.0026579.
Paylaşım yaptığımda size email gelmiyorsa sırasıyla profil ayarları-bildirimler-takip ettiğiniz yazarlar altında bulunan eposta seçeneklerinin seçili olmasına dikkat edin.
ÖNEMLİ NOT :
-İşlemlerinizde kar ne kadar önemli ise STOP noktanız da o kadar önemlidir mutlaka STOP kullanın.
-Burada analizini paylaştığım hiçbir hissenin , alım-satımını şahsen yapmıyorum. Bu hisseyi veya başka bir hisseyi , benim aldığımı düşünerek alım yapmayınız.
-Sizlerden rica ederim eğitim amaçlı paylaştığım grafiklerde nereden alınıp nereden satılmasını sormayınız bu işlem yatırım danışmanlığına girer ve bu işi yetkili insanlar yapıyor.Ben yatırım danışmanı değilim.
-Bu analiz tamamen benim öngörüm eğitim çalışmasıdır amacım Teknik analize başlamış yada başlayacak olanlara yol göstermek.Böyle olacak diye bir kaide yoktur. Sonucunda oluşabilecek zararlardan kesinlikle sorumlu değilim. Kendi kararınızı kendiniz veriniz. Saygılarımla.

XU100 // ÜÇGEN FORMASYONUSaatlik grafikte üçgen içinde sıkışma devam ediyor.Kırılım yukarı yönlü olursa hedefler fibonacciye göre belirlenmiştir.Mevcut durum düşünüldüğünde üçgenin alt bandı altı kapanışlar olursa zarar kes doğru karar olacaktır.
Paylaşım yaptığımda size email gelmiyorsa sırasıyla profil ayarları-bildirimler-takip ettiğiniz yazarlar altında bulunan eposta seçeneklerinin seçili olmasına dikkat edin.
ÖNEMLİ NOT :
-İşlemlerinizde kar ne kadar önemli ise STOP noktanız da o kadar önemlidir mutlaka STOP kullanın.
-Burada analizini paylaştığım hiçbir hissenin , alım-satımını şahsen yapmıyorum. Bu hisseyi veya başka bir hisseyi , benim aldığımı düşünerek alım yapmayınız.
-Sizlerden rica ederim eğitim amaçlı paylaştığım grafiklerde nereden alınıp nereden satılmasını sormayınız bu işlem yatırım danışmanlığına girer ve bu işi yetkili insanlar yapıyor.Ben yatırım danışmanı değilim.
-Bu analiz tamamen benim öngörüm eğitim çalışmasıdır amacım Teknik analize başlamış yada başlayacak olanlara yol göstermek.Böyle olacak diye bir kaide yoktur. Sonucunda oluşabilecek zararlardan kesinlikle sorumlu değilim. Kendi kararınızı kendiniz veriniz. Saygılarımla.

#ALVESGrafiği pek beğenmedim, taramada çıktığı ve kısa vadede küçük marjlar alınabilir diye paylaşıyorum.
YASAL UYARI
Burada yer alan yatırım bilgi, yorum ve tavsiyeler yatırım danışmanlığı kapsamında değildir. Yatırım danışmanlığı hizmeti, yetkili kuruluşlar tarafından kişilerin risk ve getiri tercihleri dikkate alınarak kişiye özel sunulmaktadır.
Burada yer alan yorum ve tavsiyeler ise eğitim amaçlıdır.
Bu tavsiyeler mali durumunuz ile risk ve getiri tercihlerinize uygun olmayabilir.
Bu nedenle, sadece burada yer alan bilgilere dayanılarak yatırım kararı verilmesi beklentinize uygun sonuçlar doğurmayabilir.

#KCAERYASAL UYARI
Burada yer alan yatırım bilgi, yorum ve tavsiyeler yatırım danışmanlığı kapsamında değildir. Yatırım danışmanlığı hizmeti, yetkili kuruluşlar tarafından kişilerin risk ve getiri tercihleri dikkate alınarak kişiye özel sunulmaktadır.
Burada yer alan yorum ve tavsiyeler ise eğitim amaçlıdır.
Bu tavsiyeler mali durumunuz ile risk ve getiri tercihlerinize uygun olmayabilir.
Bu nedenle, sadece burada yer alan bilgilere dayanılarak yatırım kararı verilmesi beklentinize uygun sonuçlar doğurmayabilir.
