Gabriel's Relative Strength IndexGabriel’s RSI—The Reinvention of Relative Strength
Not your average RSI.
This is a fully reengineered Relative Strength Index that merges the power of advanced signal processing, adaptive smoothing, volume dynamics, and intelligent divergence detection into a single, modular toolkit designed for precision trading across all markets.
Whether you’re scalping crypto, swing trading equities, or dissecting futures contracts—Gabriel’s RSI adapts to your strategy with unrivaled control and clarity.
1. RSI Settings
RSI Length (Jurik): Set to 51 by default to mimic a 21-period standard RSI when Jurik smoothing is applied. Adjust lower (e.g., 22) to mimic a 9-period RSI.
RSI Source: The default is hlc3 for smoother RSI inputs. Can be changed to any price-based series (close, open, etc.) for customization.
2. RSI Smoothing Options
MA Type: Smoothing applies to both RSI and its MA overlay simultaneously. I used to use the 56 EMA RSI, and it works well too.
JMA: Best for adaptive recursive smoothing. A power of 2 and a phase of 50 are used.
T3: Smooth and lag-reduced, suitable for trend detection. The alpha is 0.7.
SMA + Bollinger Bands: Adds deviation-based envelopes for volatility spotting.
MA Length: Affects how smooth or reactive the RSI signal is.
BB StdDev: Only relevant if BBs are used. Controls bandwidth for overbought/oversold zones.
3. MACD Settings
Fast/Slow Length: Defaults (21/81) optimized for smoother MACD with SMA or T3. For Algo trading, EMA/JMA is best.
Signal Length: Shorter (e.g., 2) gives more reactive crossover signals, it can be increased.
Source: Default is close. Close works best for the settings I input.
MA Types: JMA and EMA reduce noise and increase signal generation. Select SMA for simplicity or T3 for trend-following.
Histogram: Bar colors signal strength and trend of MACD directly on your chart.
4. Directional Movement Index (DMI)
ADX Smoothing: High values (e.g., 100) offer strong trend confirmation with Hann Window smoothing.
DI Length: Affects DI+/- sensitivity. 100 ADX - 12 DI or 15 ADX - 35 DI are suggested, the latter for quicker boot time, as 100 bars is quite long.
Smoothing Type: Choose Hann Window for refined smoothing; RMA (SMMA) for simplicity.
Volatility Type: ATR includes gaps; ADR is useful for gapless strategies.
5. Volume Z-Score
%R Length: Normalizes volume to percentile range (73 swing, 112 exhaustion).
Z-Score Lengths: Compares short-term and long-term volume trends with Z-scores of volume.
Fast Z-Score < Slow Z-Score = Gives a Volume Squeeze.
Fast MA > Slow MA = Bullish Volume Divergence; volume has been fired. Not via Z-score, but instead via SMA, ALMA, and RMA of volume.
WPR Volume: Weighted %R used to highlight exhaustion/pivot points.
Plot volume bars after a volume squeeze has been fired; if bars aren't plotted, then it's under squeeze. Backtest on ES1! Prove it's good for catching bottoms below 15 minutes as well.
6. Divergence Engine
Pivot Settings: Pivot Period (12), Divergence minval Lookback (5), and max Lookback Bars (100) control sensitivity. Works well on any asset class; these are the optimal settings for the RSI.
Source Options: RSI, MACD, ADX, DI difference, or Volume %R.
Divergence Type:
Regular: Classic reversal signals.
Hidden: Continuation signals.
Heikin Ashi Mode: Enables use of HA candles on normal charts for smoother pivots. May distort values if your chart is H.A. so leave it unchecked then.
7. Squeeze Momentum (SQZMOM)
Squeeze Types:
Wide (Black): Regular compression
Normal (Red), Regular Squeeze
Narrow (Yellow), Golden Squeeze
Very Narrow (Purple) Extreme compression
Fired (Green): Breakout detected
Plotted as circles on the bottom of my indicator.
Momentum Bar Colors:
Cyan: Rising momentum
Blue: Pullback within uptrend
Red: Falling momentum
Yellow: Correction within downtrend
Reversal Lines: Dashed lines indicate momentum crossing its Jurik MA (DM-Style Pivots).
Plotted as squares on the top of my indicator.
8. Rate of Change (RoC)
RoC of Momentum: EMA-smoothed RoC on momentum for leading signals. Double smoothed, once and then another time for smoother signals.
Signal Line: JMA used to filter noise and generate reversal signals.
Crossovers: Bullish/bearish signals based on RoC vs signal line are plotted as triangles directly on your chart.
Optimized: Backtested for short-term setups like 1H or faster. Works on Daily timeframes as well for Futures.
9. Multi-Timeframe Squeeze Settings
Each timeframe (Hourly, 4H, Daily, Weekly, Monthly) has:
Reversal Toggle: Enables dashed line DM-Style Pivots on crossovers.
MA Length: For Jurik MA smoothing on momentum.
BB/KC Thresholds: Define squeeze sensitivity per timeframe. A shorter BB/KC length, 17-14-12, responds better on lower timeframes.
Momentum Length: Tailors oscillator responsiveness; 20 is ideal.
10. BB Std. Deviation Scaling
Low-Pass Super Smoother : Smooths (True Range) noise for BBs.
High-Pass Butterworth : Extracts cycles for BB Stdv. blend.
Root Mean Squared : Dynamic BB width adjustment based on market activity.
11. Alerts
RSI: Overbought/oversold reversals.
MACD: Histogram shift through zero line.
DMI/ADX: Crossovers and strength conditions.
Volume: Smart Money alerts on low-volume zones.
Squeeze: Alerts on all 5 squeeze states.
Momentum: Crosses and reversals.
RoC: Bullish and bearish crosses.
Divergences: Regular, hidden, combined.
12. Visual Output Summary
RSI Line + MA/BBs
MACD Histogram Bar Colors
DMI/ADX as area fills
Volume %R columns
Squeeze Momentum Shapes and Dots
RoC Crossover Arrows
DM Reversal Lines
Divergence Lines and Labels
Best Practices
Combine RSI Divergence with MACD histogram cross and Squeeze firing for precise entry.
Use Volume Z-Score to filter for institutional activity, and enter Long. Watch for reversals as well.
Watch RoC crossovers for fast, leading signals.
Enable Reversal Lines on 1H+ charts for breakout or breakdown pivots.
Use multi-timeframe thresholds for swing confirmation. The TFs I use the most are 2-5-15 minutes for futures and swinging with 1 hour daily and weekly. Those are the TFs I backtested.
Göstergeler ve stratejiler


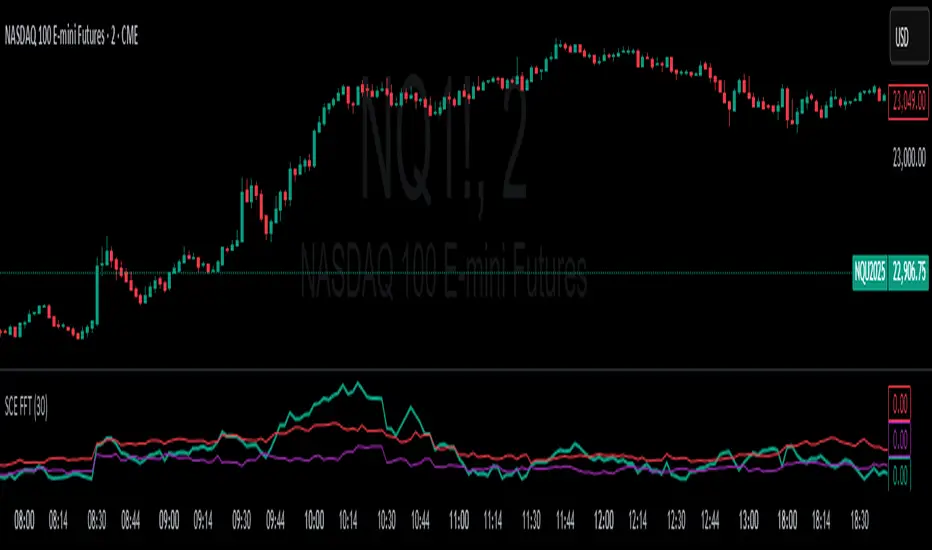
Fast Fourier Transform [ScorsoneEnterprises]The SCE Fast Fourier Transform (FFT) is a tool designed to analyze periodicities and cyclical structures embedded in price. This is a Fourier analysis to transform price data from the time domain into the frequency domain, showing the rhythmic behaviors that are otherwise invisible on standard charts.
Instead of merely observing raw prices, this implementation applies the FFT on the logarithmic returns of the asset:
Log Return(𝑚) = log(close / close )
This ensures stationarity and stabilizes variance, making the analysis statistically robust and less influenced by trends or large price swings.
For a user-defined lookback window 𝑁:
Each frequency component 𝑘 is computed by summing real and imaginary projections of log-returns multiplied by complex exponential functions:
𝑒^−𝑖𝜃 = cos(𝜃)−𝑖sin(𝜃)
where:
θ = 2πkm / N
he result is the magnitude spectrum, calculated as:
Magnitude(𝑘) = sqrt(Real_Sum(𝑘)^2 + Imag_Sum(𝑘)^2)
This spectrum represents the strength of oscillations at each frequency over the lookback period, helping traders identify dominant cycles.
Visual Analysis & Interpretation
To give traders context for the FFT spectrum’s values, this script calculates:
25th Percentile (Purple Line)
Represents relatively low cyclical intensity.
Values below this threshold may signal quiet, noisy, or trendless periods.
75th Percentile (Red Line)
Represents heightened cyclical dominance.
Values above this threshold may indicate significant periodic activity and potential trend formation or rhythm in price action.
The FFT magnitude of the lowest frequency component (index 0) is plotted directly on the chart in teal. Observing how this signal fluctuates relative to its percentile bands provides a dynamic measure of cyclical market activity.
Chart examples
In this NYSE:CL chart, we see the regime of the price accurately described in the spectral analysis. We see the price above the 75th percentile continue to trend higher until it breaks back below.
In long trending markets like NYSE:PL has been, it can give a very good explanation of the strength. There was confidence to not switch regimes as we never crossed below the 75th percentile early in the move.
The script is also usable on the lower timeframes. There is no difference in the usability from the different timeframes.
Script Parameters
Lookback Value (N)
Default: 30
Defines how many bars of data to analyze. Larger N captures longer-term cycles but may smooth out shorter-term oscillations.


LinearRegfressionL'indicatore fornisce una semplice regressione lineare dei valori High, Low, Open, Close

Daily 10-ATR & %ATR (Top Right)Better version to be able to see ATR and the percentage it has moved at a glance, no charting just the numbers

EMAs + LSMA Cross Alert (Mejorado)his indicator is designed to identify buy and sell signals based on the behavior of multiple exponential moving averages (EMAs) and a Least Squares Moving Average (LSMA). It includes 5 EMAs and one LSMA, with visual and alert features.
📌 Components:
EMA 4 (purple)
EMA 9 (Fuchsia)
EMA 21 (blue)
EMA 50 (Green)
EMA 200 (maroon)
LSMA 30 (Orange)
🔍 Signal Logic:
✅ Buy Signal:
The LSMA (30) must be below both EMA 4 and EMA 9.
A bullish crossover occurs: EMA 4 crosses above EMA 9.
Only one signal is triggered per crossover, avoiding repeated alerts during trend continuation.
❌ Sell Signal:
The LSMA (30) must be above both EMA 4 and EMA 9.
A bearish crossover occurs: EMA 4 crosses below EMA 9.
Only one signal is triggered per crossover, avoiding repeated alerts during trend continuation.
🖥️ Visual Features:
Option to show/hide each EMA and the LSMA.
Buy/Sell markers appear at cross points.
A white background highlight marks the candle where the signal occurs (optional).
Visuals scale dynamically with the chart zoom and axes.
🔔 Alerts:
Custom alert conditions for Buy and Sell.
Alerts can trigger push notifications to the TradingView mobile app, email, or webhook.
Configured to avoid repeating alerts unless the trend resets and a new valid crossover occurs.

ATR Label (Top Right)Final version easier to run daily ATR first, then move to lower time frames, only purpose is to see the ATR quick


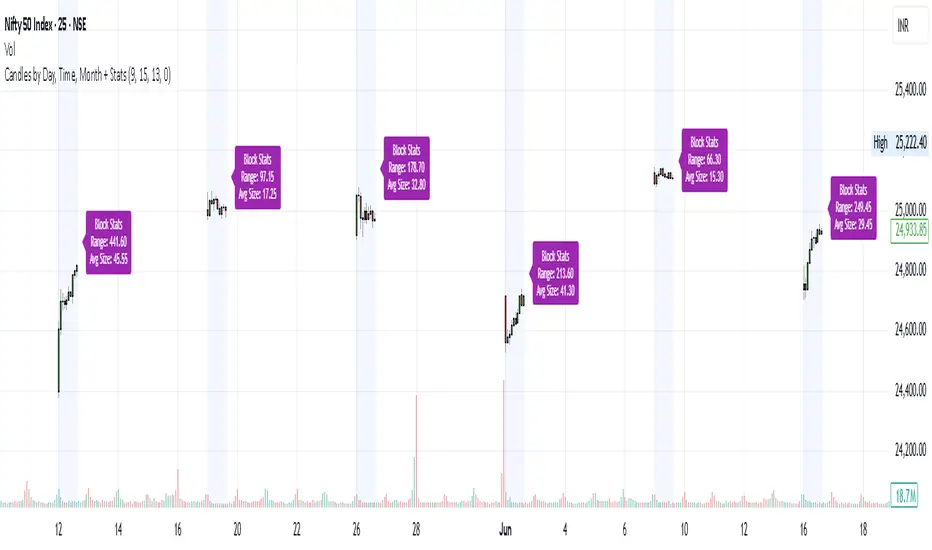
Candles by Day, Time, Month + StatsThis Pine Script allows you to filter and display candles based on:
📅 Specific days of the week
🕒 Custom intraday time ranges (e.g., 9:15 to 10:30)
📆 Selected months
📊 Shows stats for each filtered block:
🔼 Range (High – Low)
📏 Average candle body size
⚙️ Key Features:
✅ Filter by day, time, and month
🎛 Toggle to show/hide the stats label
🟩 Candles are drawn only for selected conditions
📍 Stats label is positioned above session high (adjustable)
⚠️ Important Setup Instructions:
✅ 1. Use it on a blank chart
To avoid overlaying with default candles:
Open the chart of your preferred symbol
Click on the chart type (top toolbar: "Candles", "Bars", etc.)
Select "Blank" from the dropdown (this will hide all native candles)
Apply this indicator
This ensures only the filtered candles from the script are visible.
Adjust for your local timezone
This script uses a hardcoded timezone: "Asia/Kolkata"
If you are in a different timezone, change it to your own (e.g. "America/New_York", "Europe/London", etc.) in all instances of:
time(timeframe.period, "Asia/Kolkata")
timestamp("Asia/Kolkata", ...)
Use Cases:
Opening range behavior on specific weekdays/months
Detecting market anomalies during exact windows
Building visual logs of preferred trade hours
TVI-3 Z-Score: MA + VWAP + BB Composite🔧 Overview:
It combines:
Z-score of price relative to the 200-period simple moving average (MA)
Z-score of price relative to the 200-period VWAP (volume-weighted average price)
Z-score of Bollinger Band width
The result is an average of these three Z-scores, plotted as a composite indicator for identifying overvalued and undervalued conditions.

Normalized 180-Day RP Change (Z-Score)180 day RP change with less alpha decay, good for picking tops on 1d tf

Day and DateA simple indicator that show day and date at the start of each day. This is usefull in case you are downloading charts or get confused when studying past charts for expiry and non expiry day actions.

Normalized Reserve Risk (Proxy Z-Score)normalised version of the reserve risk indicator on btc magazine because the btc magazine one is poo .

minchang volume tradingCondition
Point color
Volume ≥ 3× MA(24)
Violet
Volume ≥ 1.5× MA(24)
Red
Volume < 1.5× MA(24) & bullish
White
Volume < 1.5× MA(24) & bearish
Black

Nến Tô Màu Theo Volume / MA(21)Condition
Point color
Volume ≥ 3× MA(24)
Violet
Volume ≥ 1.5× MA(24)
Red
Volume < 1.5× MA(24) & bullish
White
Volume < 1.5× MA(24) & bearish
Black

AV BTC Investor ToolThe Investor Tool
Created by Philip Swift . Intended to be used by long term investors . The tool uses two simple moving averages of price as the basis for under/overvalued conditions: the 2-year MA (green) and a 5x multiple of the 2-year MA (red).
Price below the 2-year average: often means good profits and a bear market bottom .
Price above the 5x average: usually shows a bull market top , so investors may want to be cautious.

