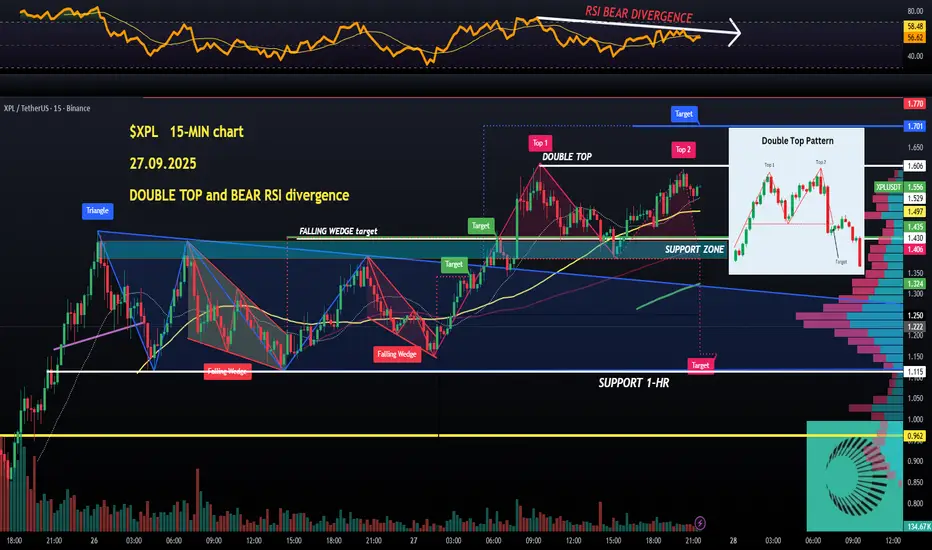
Okay,  XPL is finally showing first signs of losing steam after hitting a DOUBLE TOP with bearish RSI divergence (equal high on price, and lower high on RSI = weakening momentum).
Support zone: $1.38 (also the DOUBLE TOP's neckline, breakdown below would target $1.15) up to $1.43 (previous rejections from this level as resistance, flipped).
The double TOP doesn't mean a reversal is here, but surely works as a red flag.
I will try and buy at discount prices between $1.10 and $1.15, in case of a breakdown or another Sunday nite bloodbath.
No longs for me yet, but they will come💙👽
Feragatname
Bilgiler ve yayınlar, TradingView tarafından sağlanan veya onaylanan finansal, yatırım, alım satım veya diğer türden tavsiye veya öneriler anlamına gelmez ve teşkil etmez. Kullanım Koşulları bölümünde daha fazlasını okuyun.
Feragatname
Bilgiler ve yayınlar, TradingView tarafından sağlanan veya onaylanan finansal, yatırım, alım satım veya diğer türden tavsiye veya öneriler anlamına gelmez ve teşkil etmez. Kullanım Koşulları bölümünde daha fazlasını okuyun.