XLP 48.20: 6-month triangle top weighs and projects lower
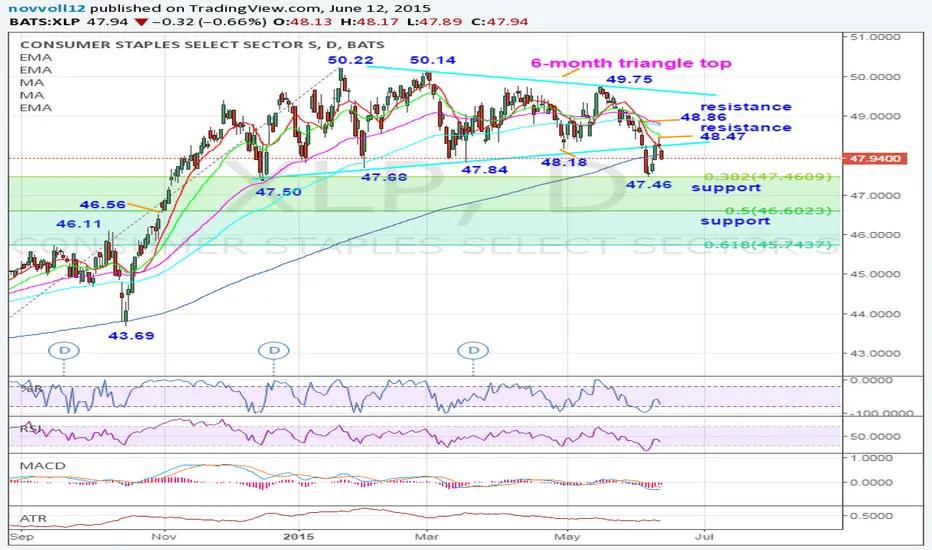
XLP broke below the 47.50 support (December 16, 2015) to post a new 6-month low at 47.46 (June 8, 2015) before consolidating. The 6-month triangle top (as shown on the daily chart) continues to weigh and projects lower. Below the 47.46/47.50 key support area would extend the fall towards 46.56 (October 31, 2014 low) near 50% of the 43.69/50.22 rise next. Below lies the 45.71 support (June 19, 2014 high) near 61.8% of the 43.69/50.22 rise. However, if the 47.46/47.50 support area manages to contain the losses, bulls need to reclaim the 48.47 then 48.86 resistance levels to suggest stabilization.
Outlook:
Short term: bearish
Long term: bearish
Outlook:
Short term: bearish
Long term: bearish
İlgili yayınlar
Feragatname
Bilgiler ve yayınlar, TradingView tarafından sağlanan veya onaylanan finansal, yatırım, işlem veya diğer türden tavsiye veya tavsiyeler anlamına gelmez ve teşkil etmez. Kullanım Şartları'nda daha fazlasını okuyun.
Feragatname
Bilgiler ve yayınlar, TradingView tarafından sağlanan veya onaylanan finansal, yatırım, işlem veya diğer türden tavsiye veya tavsiyeler anlamına gelmez ve teşkil etmez. Kullanım Şartları'nda daha fazlasını okuyun.