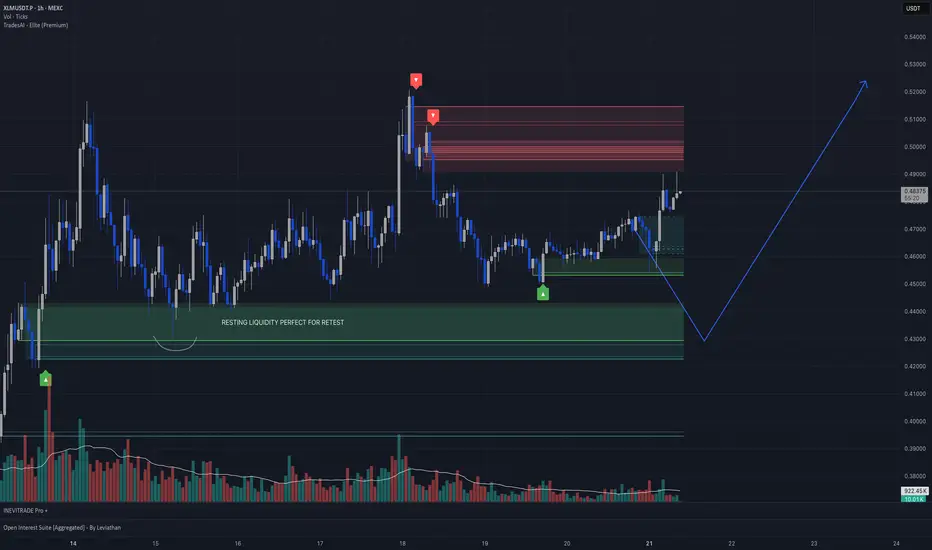
Hey everyone! Thrilled to present my first TradingView idea! Check out this XLM/USDT 1-hour chart from MEXC. I’ve identified a key “resting liquidity” zone at 0.4100–0.4200, where I expect a retest soon. The price surged from 0.4000 to 0.5200, hit resistance, and is now consolidating around 0.47388. This green zone was a consolidation area before the breakout, and with high volume at the peak dropping during the pullback, it’s a prime dip zone. If it holds, we could see a move back to 0.5200!
Feragatname
Bilgiler ve yayınlar, TradingView tarafından sağlanan veya onaylanan finansal, yatırım, işlem veya diğer türden tavsiye veya tavsiyeler anlamına gelmez ve teşkil etmez. Kullanım Şartları'nda daha fazlasını okuyun.
Feragatname
Bilgiler ve yayınlar, TradingView tarafından sağlanan veya onaylanan finansal, yatırım, işlem veya diğer türden tavsiye veya tavsiyeler anlamına gelmez ve teşkil etmez. Kullanım Şartları'nda daha fazlasını okuyun.