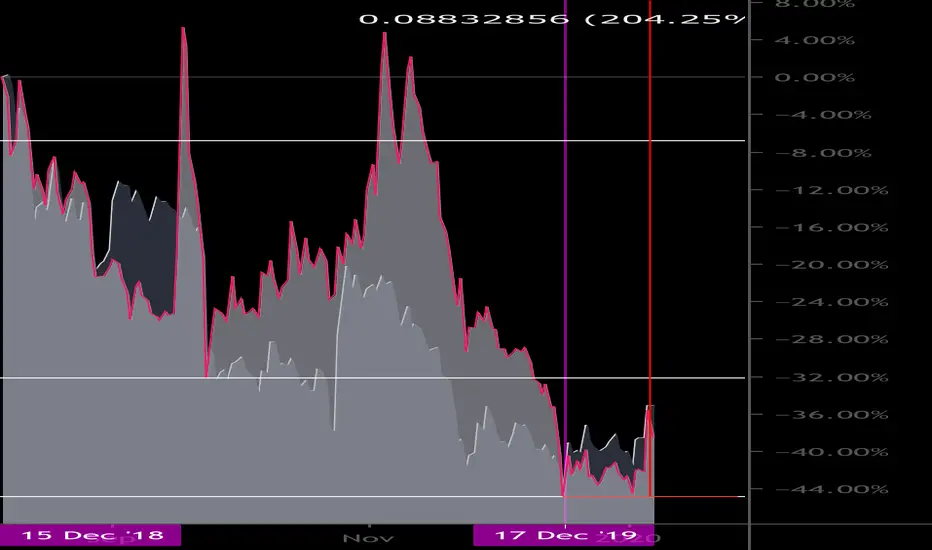
Fun chart to play around with. Xlmusd in foreground and Btcusd in background. White horizontal lines correspond to different Xlmusd accumulation phases that started in December ‘18.
Price should rise 200% from Dec ‘19 low.
Price should rise 200% from Dec ‘19 low.
Not
For those interested, probable distribution that would form CNH when completed. Would make for some great growth.
Not
Btw, I based the 200% growth on this view of the chart:İlgili yayınlar
Feragatname
Bilgiler ve yayınlar, TradingView tarafından sağlanan veya onaylanan finansal, yatırım, işlem veya diğer türden tavsiye veya tavsiyeler anlamına gelmez ve teşkil etmez. Kullanım Şartları'nda daha fazlasını okuyun.
İlgili yayınlar
Feragatname
Bilgiler ve yayınlar, TradingView tarafından sağlanan veya onaylanan finansal, yatırım, işlem veya diğer türden tavsiye veya tavsiyeler anlamına gelmez ve teşkil etmez. Kullanım Şartları'nda daha fazlasını okuyun.