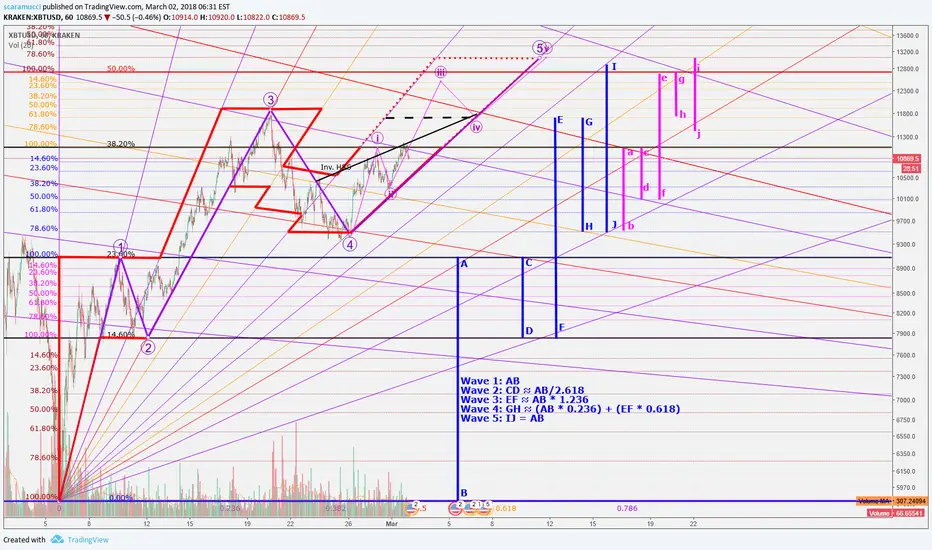
As you can see, this is not your usual technical analysis. Because this method has not been tested and approved, take it with a grain of salt. It's more of a proof of concept than anything else, and the proof may fail miserably at some point, even if up to now, it seems to be holding up well.
All the thin lines have been drawn using Fibonacci speed/resistance and Fibonacci retracement. The dotted horizontal ones are Fibonacci retracements within the bigger retracement (reversed from the direction of the big one).
The red contour lines trace the path followed by Bitcoin within the grid that was made with the thin and dotted lines.
The 5th purple wave projection assumes that the height of the 5th wave will be 1:1 with the 1st wave.
With this technique, support and resistance lines should never be considered as hard walls. Often, the price will oscillate at a line before reversing or continuing it's path. They represent areas that affect the momentum to various degrees and should be seen as gradient clouds of varying opacity at the center, with the more opaque having a stronger effect on the momentum. Rather than "support" and "resistance" levels, these are areas that act as magnets for the value, simultaneously attracting and repelling it with an equal amount of force, which is why once the major lines is hit with high velocity or it if it ends up breaking, the value appears to be "projected" .
The thin black line that seems out of place represents the neck of the I H&S pattern, which now could be on it's way to becoming a complex I H&S
At the moment of writing this, the value dropped from 11174 to 10834, but it's still very much on the course for wave 5. Still scary though XD
Happy trading!
Feragatname
Bilgiler ve yayınlar, TradingView tarafından sağlanan veya onaylanan finansal, yatırım, işlem veya diğer türden tavsiye veya tavsiyeler anlamına gelmez ve teşkil etmez. Kullanım Şartları'nda daha fazlasını okuyun.
Feragatname
Bilgiler ve yayınlar, TradingView tarafından sağlanan veya onaylanan finansal, yatırım, işlem veya diğer türden tavsiye veya tavsiyeler anlamına gelmez ve teşkil etmez. Kullanım Şartları'nda daha fazlasını okuyun.
