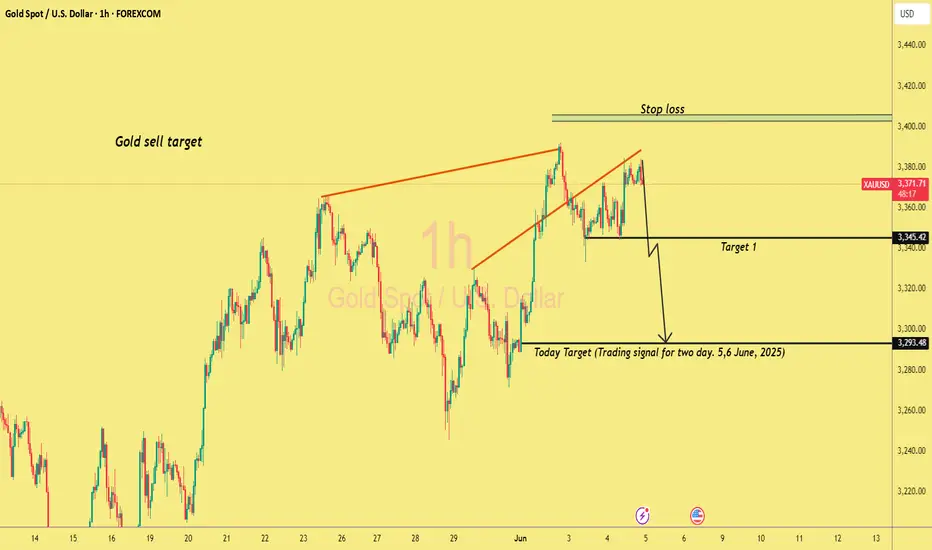
I'm provided a chart with a downward trend, indicating a potential sell signal for gold. The chart is labeled "Gold sell target" and has a "Stop loss" line above it. The "Today Target (Trading signal for two day, 5,6 June, 2025)" is also indicated on the chart.
To determine the take profit (TP) levels for a gold sell trade, we need to analyse the chart and identify potential support levels. Based on the chart, the current price is around 3,373.36 USD, and the target price is around 3,293.48 USD.
Assuming the trade is a sell trade, the take profit levels could be set at the following prices:
- TP1: 3,342.00 USD (a potential support level)
- TP2: 3,310.00 USD (another potential support level)
- TP3: 3,293.00 USD (indicated target setup in the chart)
Stop loss: around 33410
However, without more information about the trading strategy and risk management, it's difficult to provide a more specific answer.
Based on the chart, a possible take profit level for a gold sell trade could be around 3,293.48 USD, which is the "Today Target" indicated on the chart.
İşlem aktif
Target 1 hit running in 430JOIN FREE SIGNALS TELEGRAM
t.me/forexsupppar1
FOREX MARKET ANALYSIS AND IDEAS
8 YEARS EXPERIENCE IN THIS FIELD
t.me/forexsupppar1
FOREX MARKET ANALYSIS AND IDEAS
8 YEARS EXPERIENCE IN THIS FIELD
Feragatname
Bilgiler ve yayınlar, TradingView tarafından sağlanan veya onaylanan finansal, yatırım, işlem veya diğer türden tavsiye veya tavsiyeler anlamına gelmez ve teşkil etmez. Kullanım Şartları'nda daha fazlasını okuyun.
JOIN FREE SIGNALS TELEGRAM
t.me/forexsupppar1
FOREX MARKET ANALYSIS AND IDEAS
8 YEARS EXPERIENCE IN THIS FIELD
t.me/forexsupppar1
FOREX MARKET ANALYSIS AND IDEAS
8 YEARS EXPERIENCE IN THIS FIELD
Feragatname
Bilgiler ve yayınlar, TradingView tarafından sağlanan veya onaylanan finansal, yatırım, işlem veya diğer türden tavsiye veya tavsiyeler anlamına gelmez ve teşkil etmez. Kullanım Şartları'nda daha fazlasını okuyun.