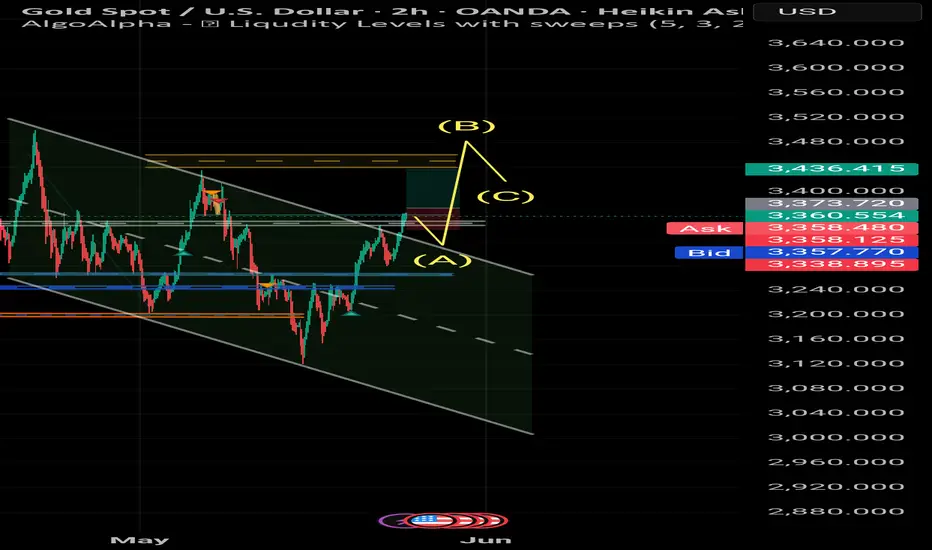
On the 2-hour Heikin Ashi chart for Gold (XAU/USD), we’re observing a flag formation after a strong upward movement. Price is currently hovering around 3360, showing consolidation inside a falling channel.
Resistance Zone: 3365–3375
Support Zone: 3345–3335
A bullish breakout is likely if price closes above the resistance area with strong momentum.
Current market volatility suggests potential for a $10–15 move in the next session.
Keep an eye on volume confirmation and possible liquidity sweep traps.
Signals:
Buy Entry: Above 3375 with confirmation
Stop Loss: Below 3335
Target 1: 3395
Target 2: 3410
Risk/Reward Ratio: ~2:1
Analysis by: mohsen mozafari nezhad
Feragatname
Bilgiler ve yayınlar, TradingView tarafından sağlanan veya onaylanan finansal, yatırım, işlem veya diğer türden tavsiye veya tavsiyeler anlamına gelmez ve teşkil etmez. Kullanım Şartları'nda daha fazlasını okuyun.
Feragatname
Bilgiler ve yayınlar, TradingView tarafından sağlanan veya onaylanan finansal, yatırım, işlem veya diğer türden tavsiye veya tavsiyeler anlamına gelmez ve teşkil etmez. Kullanım Şartları'nda daha fazlasını okuyun.