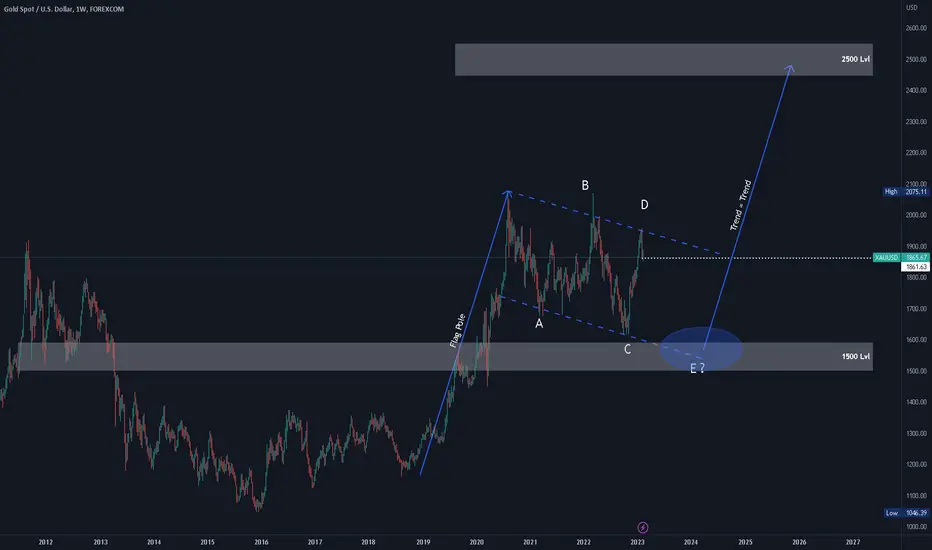
Gold is drawing a massive Flag, that could see it go all the way to 1500. After it went to 2050 and gat rejected two times in the recent years, the D point retraced to 1950, the 78.6% fib level, which isn't uncommun for gold as it likes to retrace deep. The 1500 level drawn on the chart is also the 50-61.8% Fib level of the uptrend that made up the flagpole. Looks like in the textbooks init? what you guys think??
Feragatname
Bilgiler ve yayınlar, TradingView tarafından sağlanan veya onaylanan finansal, yatırım, işlem veya diğer türden tavsiye veya tavsiyeler anlamına gelmez ve teşkil etmez. Kullanım Şartları'nda daha fazlasını okuyun.
Feragatname
Bilgiler ve yayınlar, TradingView tarafından sağlanan veya onaylanan finansal, yatırım, işlem veya diğer türden tavsiye veya tavsiyeler anlamına gelmez ve teşkil etmez. Kullanım Şartları'nda daha fazlasını okuyun.