SMC Trading point update
technical analysis of Gold Spot against USD (XAUUSD) on the 1-hour timeframe. Here's a breakdown of the key ideas presented:
Chart Analysis Summary:
1. Price Zones:
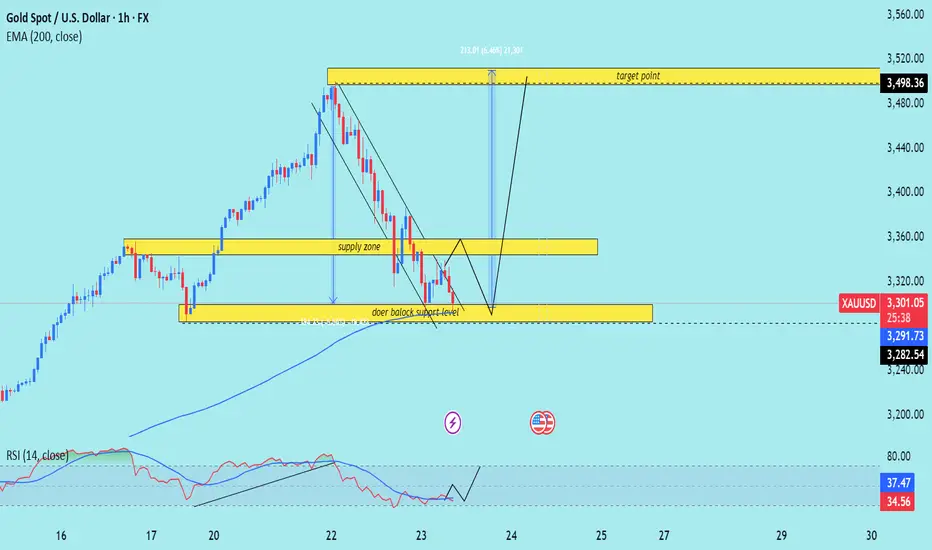
Supply Zone (Resistance): Around the 3,355–3,365 level.
Demand/Support Zone (Doer Block Support Level): Around 3,282–3,291.
2. Current Price Action:
Price is currently at $3,331.96, close to the supply zone, and bouncing between the zones.
There’s a sharp downtrend, which seems to be slowing down near the support level.
3. Projected Move:
The chart suggests a short-term dip back into the demand/support zone, followed by a bullish reversal.
Target Point: A move back up toward $3,498.36, which is marked as a significant resistance.
4. Technical Indicators:
RSI (Relative Strength Index): Currently around 36.64 and recovering, suggesting potential bullish divergence or an oversold condition.
200 EMA: Around $3,291.52, providing dynamic support — aligning with the lower demand zone.
Mr SMC Trading point
Trade Idea:
Buy Setup (Long Trade):
Entry: Near 3,282–3,291 (support zone).
Target: 3,498.36.
Stop Loss: Below the support zone (~3,270).
Overall Idea:
This is a reversal-based setup. The price is expected to retest the support before launching a bullish leg toward the target. The confluence of the EMA, support zone, and RSI near oversold adds weight to the potential for a bounce.
Pelas support boost 🚀 analysis follow)
technical analysis of Gold Spot against USD (XAUUSD) on the 1-hour timeframe. Here's a breakdown of the key ideas presented:
Chart Analysis Summary:
1. Price Zones:
Supply Zone (Resistance): Around the 3,355–3,365 level.
Demand/Support Zone (Doer Block Support Level): Around 3,282–3,291.
2. Current Price Action:
Price is currently at $3,331.96, close to the supply zone, and bouncing between the zones.
There’s a sharp downtrend, which seems to be slowing down near the support level.
3. Projected Move:
The chart suggests a short-term dip back into the demand/support zone, followed by a bullish reversal.
Target Point: A move back up toward $3,498.36, which is marked as a significant resistance.
4. Technical Indicators:
RSI (Relative Strength Index): Currently around 36.64 and recovering, suggesting potential bullish divergence or an oversold condition.
200 EMA: Around $3,291.52, providing dynamic support — aligning with the lower demand zone.
Mr SMC Trading point
Trade Idea:
Buy Setup (Long Trade):
Entry: Near 3,282–3,291 (support zone).
Target: 3,498.36.
Stop Loss: Below the support zone (~3,270).
Overall Idea:
This is a reversal-based setup. The price is expected to retest the support before launching a bullish leg toward the target. The confluence of the EMA, support zone, and RSI near oversold adds weight to the potential for a bounce.
Pelas support boost 🚀 analysis follow)
(Services:✔️ JOIN Telegram channel
#Gold trading ★Analysis★ 📊
Gold trading signals 🚀 99%
t.me/SmcTradingPoin
Join my recommended broker , link 👇
World best broker exness ✅D
one.exnesstrack.org/a/l1t1rf3p6v
#Gold trading ★Analysis★ 📊
Gold trading signals 🚀 99%
t.me/SmcTradingPoin
Join my recommended broker , link 👇
World best broker exness ✅D
one.exnesstrack.org/a/l1t1rf3p6v
İlgili yayınlar
Feragatname
Bilgiler ve yayınlar, TradingView tarafından sağlanan veya onaylanan finansal, yatırım, işlem veya diğer türden tavsiye veya tavsiyeler anlamına gelmez ve teşkil etmez. Kullanım Şartları'nda daha fazlasını okuyun.