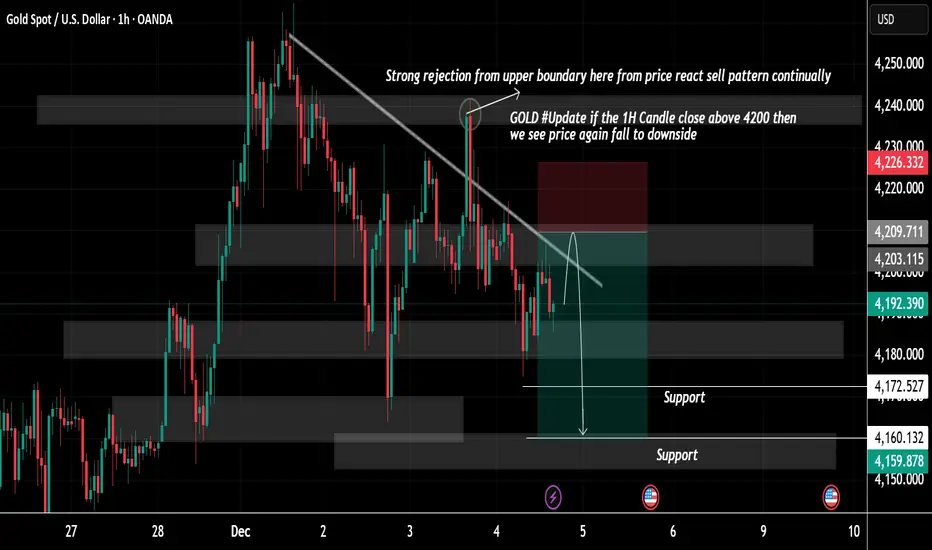
Gold price action on the 1-hour timeframe. The analysis highlights how price has been reacting to a key descending trendline and important support/resistance zones.
1️⃣ Downtrend Structure & Trendline Rejection
The chart shows a clearly defined descending trendline drawn from previous highs.
Every time the price has approached this upper boundary, it has shown strong rejection, confirming continuous selling pressure you highlighted one major rejection point where the price tried to push above the trendline but was aggressively pushed back down. This reinforces the idea that sellers are still respecting this trendline and defending it consistently.
2️⃣ Current Market Behaviour
Price is currently trading just below this trendline chart indicates that unless the 1H candle closes above the 4200 zone, the market is likely to resume its downward movement this suggests a bearish structure remains intact as long as price stays under the 4200 resistance level.
3️⃣ Key Support Zones
Two major support areas are marked:
• First Support Zone around 4172
• Second Support Zone near 4160
These areas are likely to act as targets if the price continues to fall, offering potential take-profit levels for sellers. They also represent regions where buyers might step in, so traders will be watching how price reacts there.
4️⃣ Trade Concept Illustrated
You have visually outlined a short (sell) trade idea:
• Price is expected to retest the descending trendline.
• If the rejection continues, price is projected to drop downward toward the lower support zones.
• The green zone represents the potential profit area, while the red zone shows the risk if price breaks above resistance.
This visually communicates a trend continuation setup, where traders follow the prevailing downtrend instead of counter-trading.
5️⃣ Overall Interpretation
Your chart analysis suggests:
• Gold is still respecting the downtrend.
• Sellers are active around the trendline.
• Continued bearish movement is expected unless price breaks above the 4200 level with a strong candle close.
• The support zones below provide clear levels where price may slow down or reverse.
If you Find it helpful please and comments for this post and share thanks.
İşlem aktif
If the price does not cross the level 4230 we could expect bearish zone
✅FREE FOREX Signals in Telegram
t.me/thedollarpipskiller
✅ Suggest News Channel
t.me/addlist/5h3Y2WG2eyVkOTY0
t.me/thedollarpipskiller
✅ Suggest News Channel
t.me/addlist/5h3Y2WG2eyVkOTY0
İlgili yayınlar
Feragatname
Bilgiler ve yayınlar, TradingView tarafından sağlanan veya onaylanan finansal, yatırım, alım satım veya diğer türden tavsiye veya öneriler anlamına gelmez ve teşkil etmez. Kullanım Koşulları bölümünde daha fazlasını okuyun.