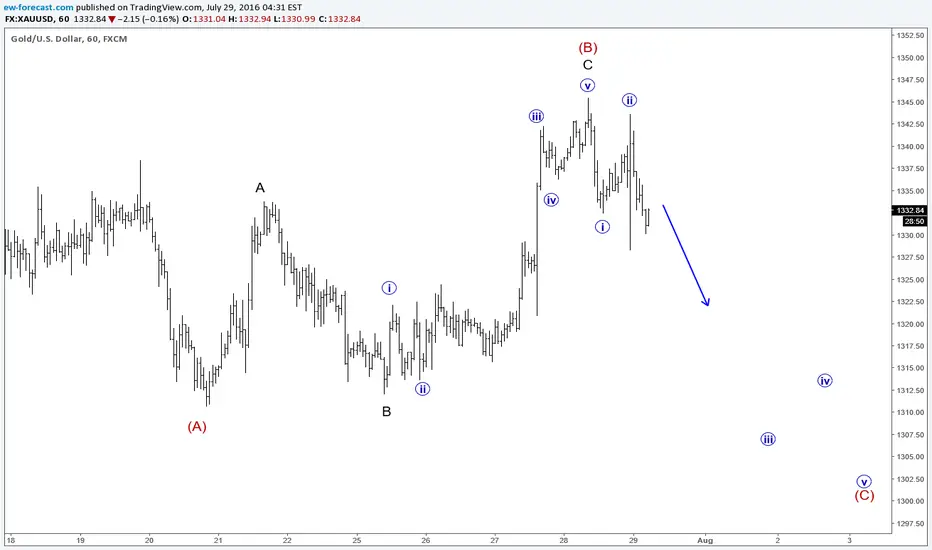
On the 1h chart of Gold we are observing an idea of a flat correction that took place in red wave (B) and could now be already over, as of recent price action. As we see three sub-waves are visible in wave B), meaning that this correction is completed, and more weakness could be in store for wave C, ideally towards the 1310 mark.
ew-forecast.com
@ewforecast
ew-forecast.com
@ewforecast
US Single STOCKS (FREE Access), FX, Crypto
👉Explore Our Services @ wavetraders.com/elliott-wave-plans/
Learn Elliott Waves
👉 wavetraders.com/academy/
Newsletter Sign up
👉 bit.ly/3FVPVzO
👉Explore Our Services @ wavetraders.com/elliott-wave-plans/
Learn Elliott Waves
👉 wavetraders.com/academy/
Newsletter Sign up
👉 bit.ly/3FVPVzO
Feragatname
Bilgiler ve yayınlar, TradingView tarafından sağlanan veya onaylanan finansal, yatırım, işlem veya diğer türden tavsiye veya tavsiyeler anlamına gelmez ve teşkil etmez. Kullanım Şartları'nda daha fazlasını okuyun.