---
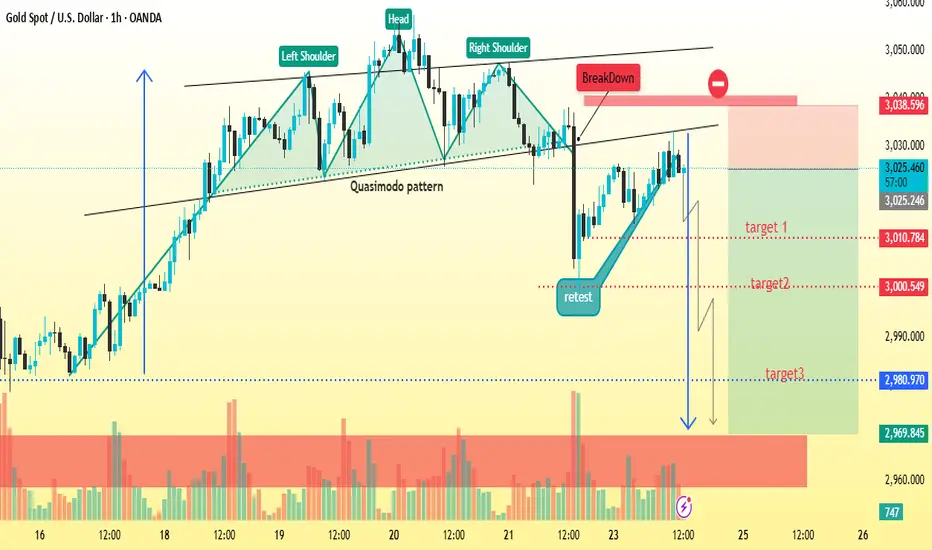
🔔 XAU/USD Trading Signal
📉 Quasimodo Pattern on 1H Chart
Key Levels:
Breakdown Level: ~3030
Current Price: ~3024
Target 1: 3010
Target 2: 3000 (Psychological Level)
Target 3: 2980
Final Target Zone: 2960 – 2970
Action Plan:
✅ Bearish confirmation after neckline retest.
✅ Targeting ~2.10% downside.
⚠ Watch for reactions near the target zone.
Risk management is key — stay disciplined! It looks like gold has broken its ascending channel, signaling a potential correction or consolidation. Based on My technical analysis targets, the key support levels to watch are:
$3,000 – Psychological level, could act as support/resistance.
$2,982 – Minor support within the current price action.
$2,955 – Potential bounce zone if selling pressure increases.
$2,924 – Deeper retracement, aligning with past structure.
$2,883 – Stronger support, where buyers may step in.
A break below these levels could indicate further downside, while a bounce from any of these could lead to a recovery. Do you see any confluence with moving averages or Fibonacci levels in your analysis?
İşlem aktif
That looks great — clear and professional. Adding a brief market sentiment or rationale could enhance it. For example:"Gold (XAU/USD) Update
✅ Sell at 3025
🎯 Take Profit 1 achieved — +300 pips secured
🔎 Focus on the next target: 2980
Market remains bearish amid stronger USD and rising bond yields. Stay cautious with trailing stops."
Would you like to tailor the insights further based on technical indicators or news?
Feragatname
Bilgiler ve yayınlar, TradingView tarafından sağlanan veya onaylanan finansal, yatırım, işlem veya diğer türden tavsiye veya tavsiyeler anlamına gelmez ve teşkil etmez. Kullanım Şartları'nda daha fazlasını okuyun.
Feragatname
Bilgiler ve yayınlar, TradingView tarafından sağlanan veya onaylanan finansal, yatırım, işlem veya diğer türden tavsiye veya tavsiyeler anlamına gelmez ve teşkil etmez. Kullanım Şartları'nda daha fazlasını okuyun.